

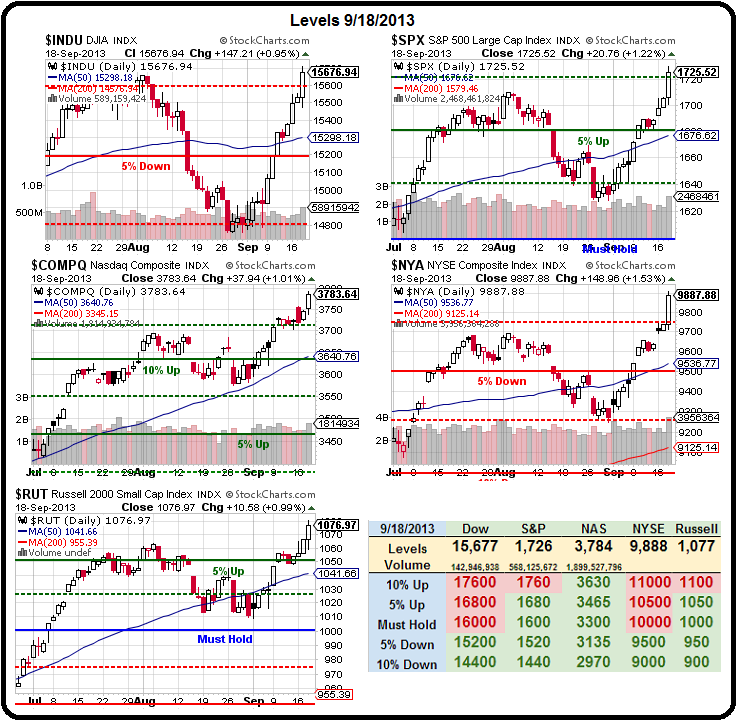 Holy cow, look at that Dow line:
We have gone from 14,700 to 15,700 (6.8%) in 3 weeks. At this pace, we'll be at 19,000 by December 31st and over 20,000 in January and 32,000 at the end of next year! Wow, that is so normal, right?
Of course, the Fed DID put $1Tn into the market yesterday. Actually it was more like $2Tn because they are continuing to put $85Bn PER MONTH ($1Tn per year) into the markets through QE but they also withdrew $1,000,000,000,000 – not just from your savings account – but from every single asset you have, when they devalued the Dollar by 1% yesterday.
That's right, the US Dollar responded to the Fed's complete lack of respect for the money supply by dropping a full point yesterday and now sits at 80.03, down 4% since the Dow began rising 6.8%. Since the Dow is priced in Dollars – doesn't that then mean that the Dow is really only up 2.8% in a steady currency? 14,700 + 2.8% is only 15,111, not 15,677 and 15,111 is STILL below the 5% line. If I'm right, then 15,200 is going to be serious resistance and we can expect the Dow to grind to a halt 89 points from now, at 15,766 so that will be our new shorting target (if they even make it there).
 It is like pulling teeth getting TA people to understand that TA is USELESS if you don't take currency fluctuations into account. It's like looking at a temperature chart shooting up suddenly and then the guy drawing the chart says – yes, I used to measure in Fahrenheit but I switched to Kelvin last week and things really warmed up!
Sorry, but we were doing geek jokes yesterday and I'm still stuck in that mode…
Anyway, clearly any rational person understands that you can't have a chart where the units you are measuring in change while you are graphing your points. NORMALLY, we expect some currency fluctuation as it tends to even out over time but, looking back to 2003, when the Dollar was worth 107 against a global basket of currencies – we can see that the long-term trend has actually been pretty consistently down, bottoming us out at 72 at the top of the "rally" of 2007. 72, that's 32% lower than we were in 2003, when the Fed was cutting rates to pull us out of the early century recession.
That led us to an almost 100% gain in the S&P but 1/3 of the move was nothing but currency and, as soon as the rest of the World begain looking even more scary than the Dollar – our currency shot back up 20% and the market lost 100% of what it had gained over the past 4 years. Now, 5 years later, we've gained it all back again and then some but let's be careful and consider HOW we got here becuase what has been done can be just as quickly undone.

That's why the Fed's lack of tapering has been such a relief to the markets, especially with the other Central Banks standing pat. That makes the Dollar a bigger joke of a currency than Euros or even Yen and, therefore, anything priced in Dollars (stocks, commodities, homes) requires more of them to facillitate an exchange. Mark Hulbert estimates the inflation-adjusted high for the S&P is 2,000, not 1,700. As noted abve, the CPI adjusted chart yields an even harsher picture.
 Lowering the currency bar and boosting the markets by devaluing currency is no different that lowering standards in your kid's school so that they have As instead of Cs. While it might LOOK good on their report card and it might make them feel good about themselves and you may feel good about your genetic investments – you are all in for a very harsh dose of reality once you leave your little inflated grade bubble and venture out into the real world, right?
So, beware the rising Dollar – I'm not sure it has much further to fall at the moment because Japan REALLY doesn't want the Yen falling below 100 to the Dollar (stronger) and it's at 99.30 now. The Euro is stronger at $1.35 and the Pound is $1.60 but UK Retail Sales fell 0.9% last month with BNP calling it "one of the weakest prints on the economy for some time."
Oil shot back up to $108 on the new October contracts (/CLX3) and we shorted them in Member Chat this moring and already caught a very nice $500 per contract ride down to $107.50. Tomorrow is the last day the October contract trades (/CLV3) and there are still 79,243,000 fake barrels on contract and, if they were actually delivered to Cushing, OK next month, the US would have a 15-20M barrel PER WEEK build in inventories and prices would plunge.
|
Click for
Chart |
Current Session | Prior Day | Opt's | ||||||||
| Open | High | Low | Last | Time | Set | Chg | Vol | Set | Op Int | ||
| Oct'13 | 108.22 | 108.99 | 108.10 | 108.44 |
09:08 Sep 19 |
– |
0.37 | 14642 | 108.07 | 79243 | Call Put |
| Nov'13 | 107.44 | 108.15 | 107.30 | 107.58 |
09:08 Sep 19 |
– |
0.30 | 47456 | 107.28 | 331304 | Call Put |
| Dec'13 | 106.00 | 106.68 | 105.88 | 106.14 |
09:08 Sep 19 |
– |
0.26 | 13415 | 105.88 | 269068 | Call Put |
| Jan'14 | 104.53 | 105.15 | 104.42 | 104.57 |
09:08 Sep 19 |
– |
0.14 | 3480 | 104.43 | 87770 | Call Put |
That, of course, will not happen. What will happen is that the 79,243 fake open orders for October will be rolled into the already 331,304 fake open contracts for November to make it look like we have this MASSIVE demand for oil when, in fact, less than 20M barrels will actually be delivered in October, November and December in order to make it LOOK like we have a scarcity of oil in this country.
It's a con, plain and simple. It is the criminal manipulation of the energy markets in order to overcharge you for oil, and petroleum products – screwing you and your family out of thousands of Dollars each year but please – don't write your Congressmen – just continue to be a good little drone and pay the criminals. That's the American way…