

Courtesy of Sabrient Systems and Gradient Analytics
 As most everyone expected, Congressional brinksmanship gave way to an eleventh hour agreement that will put the government back in business and raise the debt ceiling. However, it’s only a temporary measure that merely defers another knock-down/drag-out for a few months. The question is, how will investors react after an initial bullish burst of relief?
There remains a vocal minority that is not at all happy with this country’s ongoing fiscal irresponsibility during times that they believe call for austerity rather than profligacy. And make no mistake; they are simply exercising the Constitutional power that was deliberately bestowed by the country’s founding fathers. Yes, the Affordable Care Act became law through all the appropriate channels and challenges. But the unhappy campers still have not been placated. They don’t believe their views on entitlement reform have been heard at all. Instead of instilling self-reliance in the populace to help us emerge from our lethargy, they believe we are only breeding more dependency. They acquiesced this time solely to avoid an economic meltdown. But they will be back.
Another question is, even if the bulls run like Pamplona through year-end, will it be a resumption of the junk rally and overall outperformance of lower quality stocks that has persisted during much of this year? These are the companies with weak analyst ratings and questionable earnings quality. Or will it be a more thoughtful flight to carefully selected high-quality companies, i.e., those that fundamentals-based models look upon favorably? One can hope. And there are signs that a reversion to quality already has begun.
Since last Thursday’s bullish reversal, the top performing sectors have been Financial, Energy, and Healthcare. With earnings season now underway, we’ve seen some positives from the likes of Yahoo (YHOO) American Express (AXP), and Intel (INTC), and some misses as well, including IBM (IBM) and eBay (EBAY).
The SPY chart: What a difference a week makes. Last Wednesday, the SPDR S&P 500 Trust (SPY) closed Wednesday at 165.60, just below the important 50-day simple moving average, testing support at 165, and sitting on the lower Bollinger Band. This Wednesday, SPY is above all the major simple moving average, including the 20-day, and it is fast approaching the upper Bollinger Band. I suggested last week that a go-signal from Congress would like cause a rally without much hesitation at prior resistance levels, and indeed we got a V-bottom that cut right through the moving averages and 170, as well as the uptrend line of support connecting the various lows since last November’s V-bottom. Although Slow Stochastic is a bit overbought from the big rally, RSI and MACD could move much further before looking overbought.
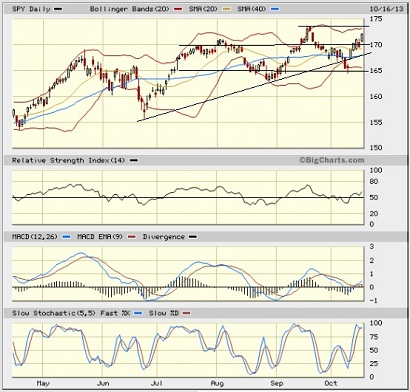
Last Thursday’s huge bullish reversal turned out to be a “90% upside day” in which 90% of volume was on the upside. This is a strongly bullish indicator. Also, check out the small caps. The iShares Russell 2000 ETF (IWM) hit a new high on Wednesday and has tripled the return of the SPY over the past month.
The CBOE Market Volatility Index (VIX), a.k.a. “fear gauge,” fell 21% on Wednesday to close the day back below the 15 threshold at 14.71. This indicates a resumption of a no-fear, risk-on (party-on) mentality.
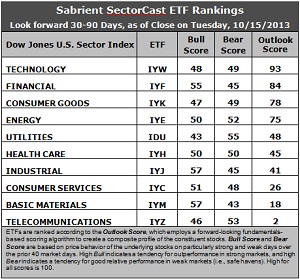
Latest rankings: The table ranks each of the ten U.S. business sector iShares ETFs by Sabrient’s proprietary Outlook Score, which employs a forward-looking, fundamentals-based, quantitative algorithm to create a bottom-up composite profile of the constituent stocks within the ETF. The multi-factor model considers forward valuation, historical earnings trends, earnings growth prospects, the dynamics of Wall Street analysts’ consensus estimates, accounting practices and earnings quality, and various return ratios. In addition, the table also shows Sabrient’s proprietary Bull Score and Bear Score for each ETF.
High Bull score indicates that stocks within the ETF have tended recently toward relative outperformance during particularly strong market periods, while a high Bear score indicates that stocks within the ETF have tended to hold up relatively well during particularly weak market periods. Bull and Bear are backward-looking indicators of recent sentiment trend.
As a group, these three scores can be quite helpful for positioning a portfolio for a given set of anticipated market conditions.
Observations:
1. Technology (IYW) remains in the top spot with a strong Outlook score of 93. IYW displays one of the lowest forward P/Es, the best return ratios, and positive sentiment among Wall Street analysts (i.e., upgraded earnings estimates). Financial (IYF) moves back into the second spot with an 84. IYE displays a low forward P/E and positive sentiment among both Wall Street analysts and company insiders (i.e., open-market buying). In third place with a score of 78 is Consumer Goods (IYK), which received the most earnings upgrades and enjoys strong return ratios. Energy (IYE) and Utilities (IDU) round out the top five.
2. Telecom (IYZ) is in the cellar yet again with a dismal Outlook score of 2. IYZ remains weak in all factors across the board, including a high forward P/E, low return ratios, a modest projected long-term growth rate, and poor Wall Street sentiment. In the bottom two again this week is Basic Materials (IYM) with a score of 18.
3. This week’s fundamentals-based rankings reflect a mostly bullish bias, as Tech and Financial sit at the top, with Energy and Industrial in the hunt, as well. It is notable that the rankings are back to a three-tier appearance, with Tech, Financial, Consumer Goods, and Energy bunched near the top, followed by a 27-point gap down to a middle tier with Utilities, Healthcare, and Industrials, and then a 15-point gap down to Consumer Services, Materials, and Telecom at the bottom.
4. Looking at the Bull scores, Industrial (IYJ) and Basic Materials (IYM) have been the leaders on particularly strong market days, scoring 57. Utilities (IDU) is the lowest at 43. The top-bottom spread is 14 points, which continues to indicate lower sector correlations on particularly strong market days, which is a sign of a healthy (and rational) market.
5. Looking at the Bear scores, Utilities (IDU) holds the top spot as favorite “safe haven” on weak market days, scoring 55. Basic Materials (IYM) is the lowest at 43. The top-bottom spread has widened to 12 points, which indicates lower sector correlations on particularly weak market days, which is an improving sign of a healthy market.
6. Overall, IYW shows the best all-weather combination of Outlook/Bull/Bear scores. Adding up the three scores gives a total of 190. IYZ is the by far the worst at 101. Looking at just the Bull/Bear combination, IYE and IYJ display the highest score of 102 this week, which indicates good relative performance in extreme market conditions (whether bullish or bearish), while IYK is the lowest at 96, which indicates investor avoidance (relatively speaking) during extreme conditions (particularly bullish conditions, in this case).
These Outlook scores represent the view that Technology and Financial sectors are still relatively undervalued, while Telecom and Materials may be relatively overvalued based on our 1-3 month forward look.
Some top-ranked stocks within IYW and IYF that look good to me this week include Apple (AAPL) NetSuite (N), MasterCard (MA), and Everest Re Group (RE).
Keep in mind, Sabrient’s Baker’s Dozen annual portfolio is now up nearly +35% from the portfolio’s inception on January 11 (more than doubling the S&P 500 return of less than +17% over the same timeframe). All 13 stocks are comfortably positive and 12 are up by double digits. Top performers include EPL Oil & Gas (EPL), Jazz Pharmaceuticals (JAZZ), and Genworth Financial (GNW). Note that a key factor in the Baker’s Dozen model is our proprietary Earnings Quality Rank, which is a pure accounting-based risk assessment signal that Sabrient developed together with subsidiary Gradient Analytics, a forensic accounting research firm. It has proven quite valuable for avoiding meltdowns that can ruin overall portfolio performance.
Disclosure: Author has no positions in stocks or ETFs mentioned.
About SectorCast: Rankings are based on Sabrient’s SectorCast model, which builds a composite profile of each equity ETF based on bottom-up aggregate scoring of the constituent stocks. The Outlook Score employs a fundamentals-based multi-factor approach considering forward valuation, earnings growth prospects, Wall Street analysts’ consensus revisions, accounting practices, and various return ratios. It has tested to be highly predictive for identifying the best (most undervalued) and worst (most overvalued) sectors, with a 1-3 month forward look.
Bull Score and Bear Score are based on the price behavior of the underlying stocks on particularly strong and weak days during the prior 40 market days. They reflect investor sentiment toward the stocks (on a relative basis) as either aggressive plays or safe havens. So, a high Bull score indicates that stocks within the ETF have tended recently toward relative outperformance during particularly strong market periods, while a high Bear score indicates that stocks within the ETF have tended to hold up relatively well during particularly weak market periods.
Thus, ETFs with high Bull scores generally perform better when the market is hot, ETFs with high Bear scores generally perform better when the market is weak, and ETFs with high Outlook scores generally perform well over time in various market conditions.
Of course, each ETF has a unique set of constituent stocks, so the sectors represented will score differently depending upon which set of ETFs is used. For Sector Detector, I use ten iShares ETFs representing the major U.S. business sectors.
About Trading Strategies: There are various ways to trade these rankings. First, you might run a sector rotation strategy in which you buy long the top 2-4 ETFs from SectorCast-ETF, rebalancing either on a fixed schedule (e.g., monthly or quarterly) or when the rankings change significantly. Another alternative is to enhance a position in the SPDR Trust exchange-traded fund (SPY) depending upon your market bias. If you are bullish on the broad market, you can go long the SPY and enhance it with additional long positions in the top-ranked sector ETFs. Conversely, if you are bearish and short (or buy puts on) the SPY, you could also consider shorting the two lowest-ranked sector ETFs to enhance your short bias.
However, if you prefer not to bet on market direction, you could try a market-neutral, long/short trade—that is, go long (or buy call options on) the top-ranked ETFs and short (or buy put options on) the lowest-ranked ETFs. And here’s a more aggressive strategy to consider: You might trade some of the highest and lowest ranked stocks from within those top and bottom-ranked ETFs.