

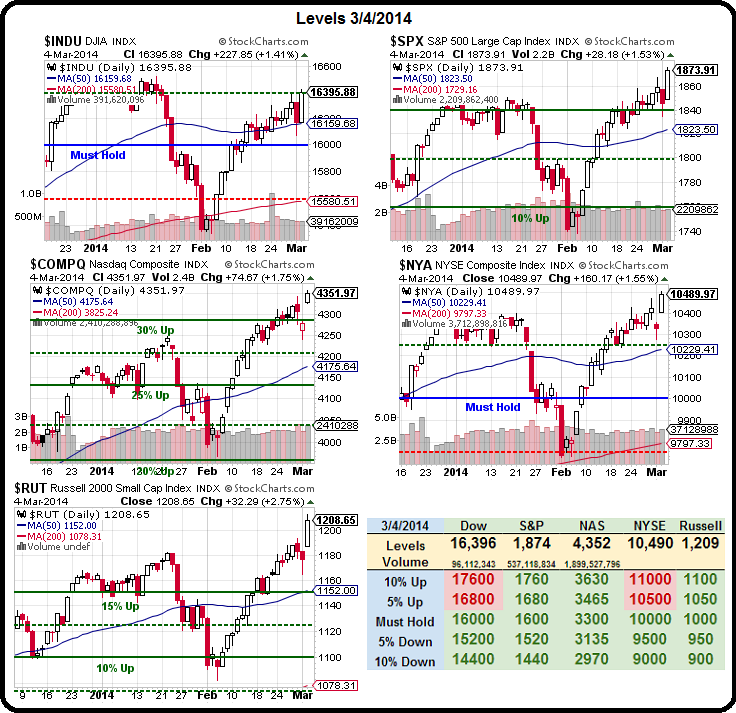 What is wrong with the NYSE?
The NYSE Composite Index consists of 1,600 US and 400 Foreign Corporations, it was re-weighted in Jan 2003 with a value of 5,000 points and hit 10,000 on June 1st, 2007 and topped out at 10,400 in Oct, 2007, dropping all the way back to 4,650 almost exactly 5 years ago, in March of 2009 – when I was pounding the table for 3 hours on TV, telling our Members to BUYBUYBUY.
Our 13 bullish trade ideas from that marathon broadcast (which included ideas for Blue Chips like GE, BAC, & DIS, as welll as TGT, AMZN and index plays on the Russell and Financials) turned $13,000 invested into $61,000 just 6 months later (up 469%) but opportunities like that only come along if you have CASH!!! to deploy.
 CASH!!! is our currently preferred position as the NYSE Summation Index is flasing a seriously overbought signal at us. This is not to say it can't get more overbought – just that we don't feel the need to participate in the Extraordinary Popular Delusions and the Madness of the Crowds at the moment.
The top 20 holding of the NYSE are XOM, JNJ, GE, WFC, BRK.B, CVX, PFE, PG, JPM, IBM, NVS, HSBC, VZ, BAC, T, MRK, KO, BP, TM and C. As I mentioned in yesterday's Live Webcast (replay availabale here), the Russell is pumped up by biotechs, like BDSI (up 670% last year), THLD (up 490%), ELU (405%), SNSS (395%), ARNA (350%), PCYC (325%), OREX (255%), etc. Think how many stocks would have to go to zero to offset gains like that!
 So there's our Russell outperformance in a nutshell and the Nasdaq has had similar tech plays like TSLA and their 300% year (doubled already this year) and Musk's other pump-fest, SCTY, which was up 438% in 2013. Again, 7 normal companies could drop to $0 and those two would offet to keep things even.
As it is, when you have just one TSLA, it adds 3% to the entire index for the year. How many market faults are being masked by a few massive gainers? That's the question we'd like to answer before chasing these all-time market highs…
As you can see from Dave Fry's Chart, the Russell has been very well-behaved in a rising channel but well-behaved cuts both ways and, at the top of that channel, odds favor shorting the RUT at 1,210 over going long there. We demonstrated that using the Russell Futures in yesterday's Live Trading Webcast and we caught the spike top at 1,212 and this morning we're at 1,205 – up $700 per contract from our 1pm seminar (we hit 1,205 at the close, it's been pretty flat since).
TZA (ultra-short Russell) is the only bearish play we've tried this week – otherwise, we're very content to sit on our sidelined cash and see which way things break. That 1,100 line is now a 10% correction away on the Russell and it would be GOOD and HEALTHY for the markets to have a correction like that if it wants to be serious about making new highs.

Doug Short's S&P Chart gives us another view of the rally and look how long it's been since we had a nice pullback. If we call it consolidation around the 1,300 mark from late 2010 to late 2012, then 1,950 is a 50% move up from there (and 1,300 was almost 100% move up from the 666 bottom) so, at some point between 1,950 and 2,000, we expect a 20% (of the rally) pullback, which is 130-140 points, so let's say 1,760ish is expected and, oddly enough, we just had such a pullback last week!
 So holding that line was a good sign and, if we hold it again, I'll be feeling much better about being bullish for a run to 2,000 but, until we get a correction that lasts more than two days, I'm just not very enthusiastic about paying these sky-high prices for equities.
Earnings that are based on laying off workers and cutting back on CapEx and buying back your own stock with the money you "saved" is not a basis for long-term investing. Buffett's companies are investing and that's a very encouraging sign but we need to see some signs that the rest of Corporate America will be following their example, so we can build a path towards sustainable growth.

Doug Short's charts above and below give a pretty clear picture of what's been driving the growth of corporate profits but look at the expectations below – how are we going to acheive these extrapolated earnings (that are already priced into the markets)? Can we fire another 14M workers or perhaps we can just pay the 140M we have left 10% – so far, we've done both over the past decade to drop 20% more to the bottom lines – why buck the trend now?

There's a war on folks, and it's not going on in the Ukraine or Afghanistan – it's a war right here in the USA between the top 1% and everyone else. Not all of us in the top 1% are participating but, when the top 1% have 35% of the wealth and the next 9% have another 38.5% and the bottom 90% are trying to eat while fighting for their share of the remaining 26.5% – it's not much of a battle, is it?
The Daily Show
Get More: Daily Show Full Episodes,The Daily Show on Facebook