

This Time Is Not Different: Why The Market Is Heading For A Fall
Courtesy of David Stockman
The 2008 Wall Street meltdown is long forgotten, having been washed away by a tsunami of central bank liquidity. Indeed, the S&P closed yesterday at 1,983—or up by nearly 200% from its March 2009 low. Yet four cardinal measures of Main Street economic health convey nothing like a 2X pick-up from the post-crisis bottom.
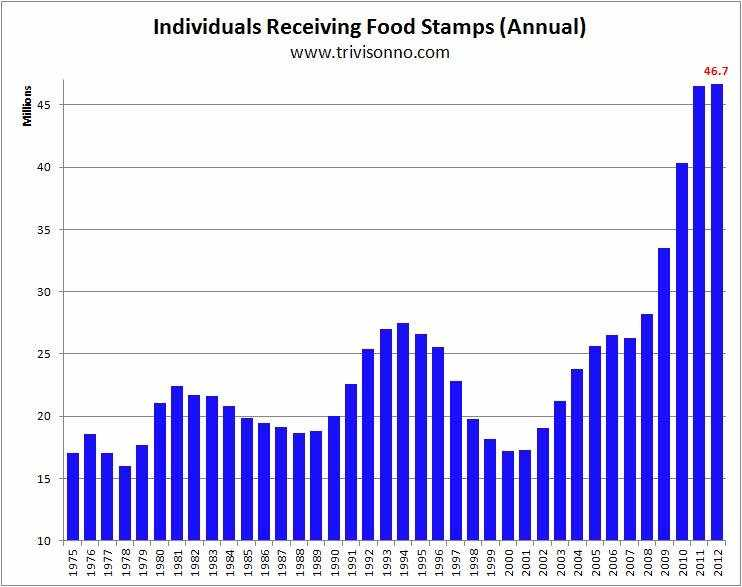
To wit, in June the count of breadwinner jobs was 68.5 million or 5% below were it stood as the crisis got underway. Likewise, business investment in real plant and equipment is still 5% below its late 2007 peak. So too with the real median family income at about $53k—its still down by 6%. And unlike past cycles where safety net programs like food stamps shed recipients as the recovery gained momentum, there are still nearly 47 million Americans in the program compared to 30 million in March 2009.
This juxtaposition has been explained away by Wall Street stock touts under the heading that “this time is different”. Markets have allegedly sprung loose from their moorings in the real economy owing to record corporate profits and an upward re-rating of PE multiples reflecting lower than historical interest rates. And, indeed, the raw facts can be marshaled to this end.
As shown in the stunning chart below, profits have doubled as a share of corporate net value added since the turn of the century. Likewise, when measured against GDP, profits are at 60-year highs.
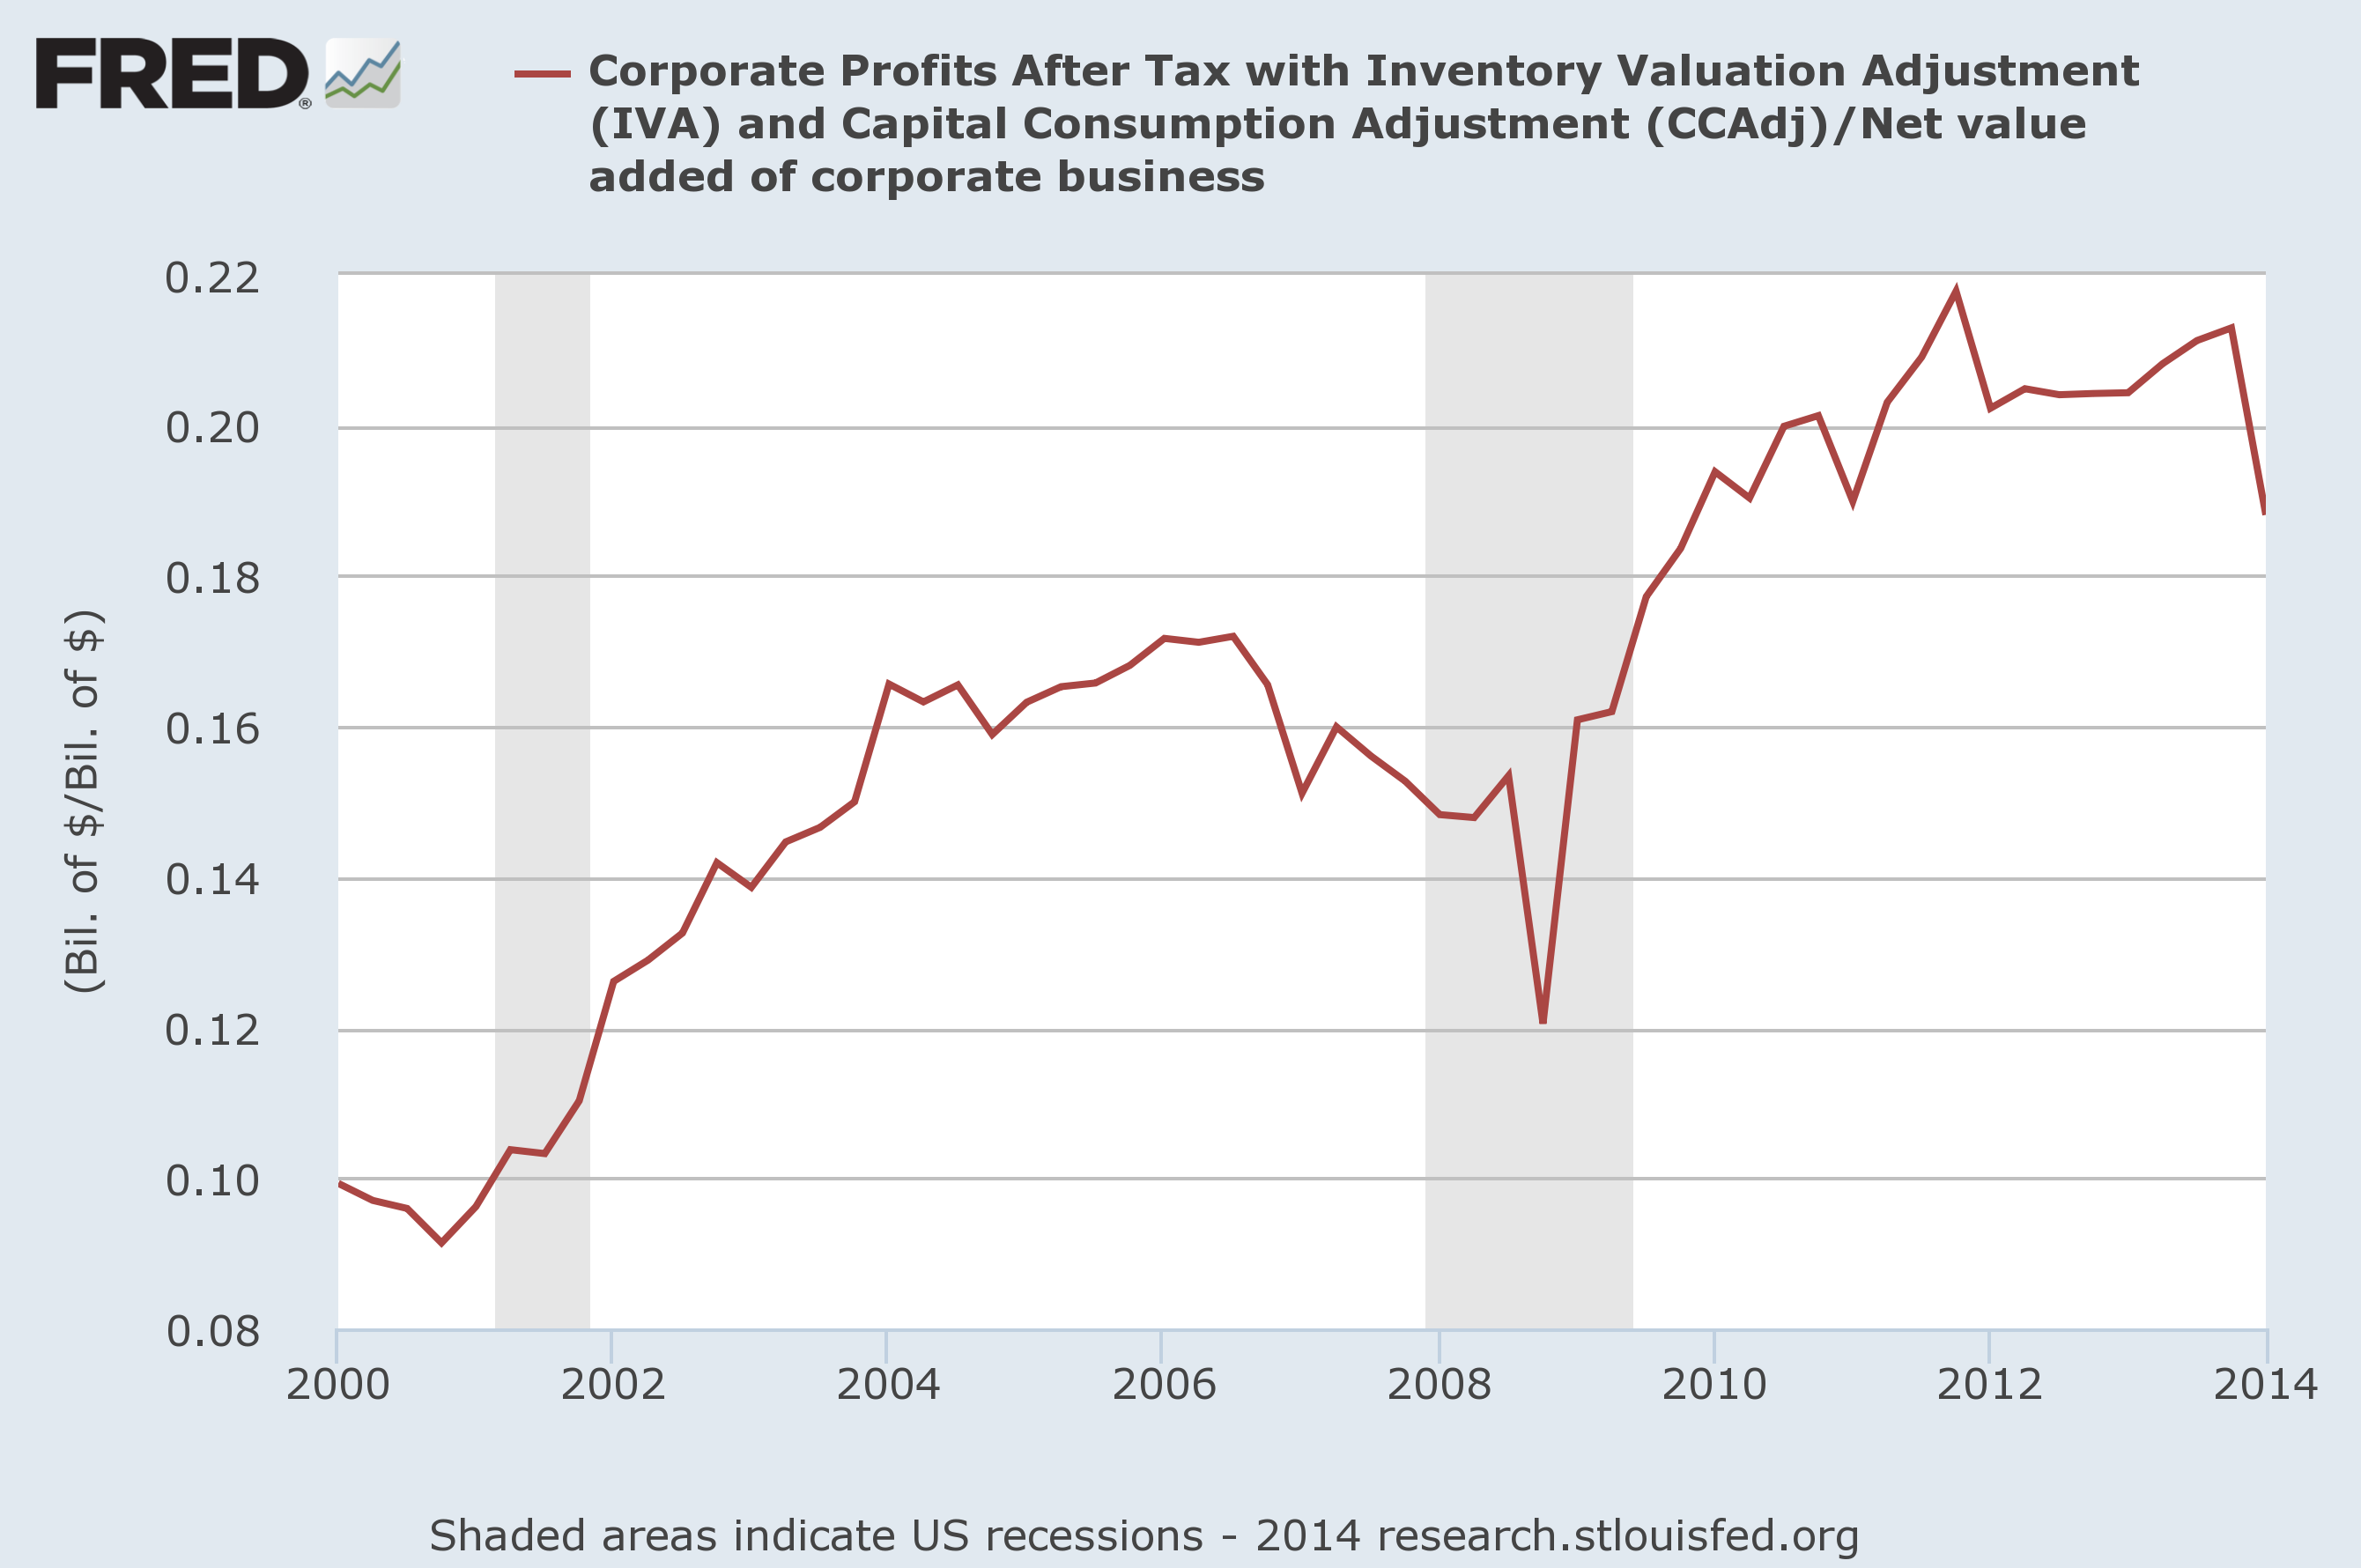
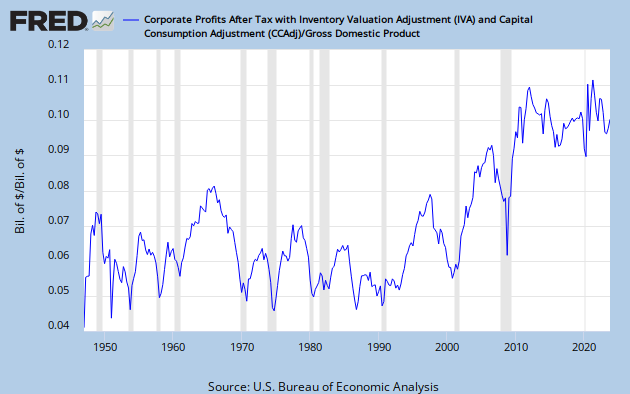
This is just the trouble, however. The robust rate of profit growth during recent years reflects a one-time gain in the profit share of factor income. This gain in all probability cannot be replicated again during the next decade, and, in fact, is extremely vulnerable to the mean reversion so evident in the historical data above. Indeed, that may have already begun during the first quarter of 2014 when the profit share dropped sharply as shown in both charts above.
The same can be said of low interest rates. After an unprecedented 33-year descent, the yield on the 10-year treasury benchmark has nowhere to go but higher; and after hitting a QE induced rock bottom of 1.5% in mid-2012, the benchmark yield has, in fact, bottomed and begun a climb toward normalization. No amount of money printing and financial repression by the central banks can keep yields on the current massive trove of $12 trillion of publicly held treasury debt at a negative after-tax and after-inflation rate indefinitely.
![]()
This is just the trouble, however. The robust rate of profit growth during recent years reflects a one-time gain in the profit share of factor income.This gain in all probability cannot be replicated again during the next decade, and, in fact, is extremely vulnerable to the mean reversion so evident in the historical data above. Indeed, that may have already begun during the first quarter of 2014 when the profit share dropped sharply as shown in both charts above.
The same can be said of low interest rates. After an unprecedented 33-year descent, the yield on the 10-year treasury benchmark has nowhere to go but higher; and after hitting a QE induced rock bottom of 1.5% in mid-2012, the benchmark yield has, in fact, bottomed and begun a climb toward normalization. No amount of money printing and financial repression by the central banks can keep yields on the current massive trove of $12 trillion of publicly held treasury debt at a negative after-tax and after-inflation rate indefinitely.
This all adds up to a case for capitalizing corporate earnings at a rate well below the historical norms, not at the tippy-top of prior experience. But the Wall Street casino is so juiced-up on the Fed’s promise of endless liquidity and puts under the stock averages that it is uninterested in the fundamentals, and will keep buying the dips until some confidence shattering black swan comes flying in from out of the blue.
And that points to the real evil of monetary central planning and the serial financial bubbles that it inexorably produces. Bubbles are now only recognized after they burst into a flaming crash. The chart below regarding the $2.3 trillion private label market in securitized sub-prime mortgages created by Wall Street in the run up to the last bubble top says it all. What were heralded to be money-good par securities because “that time was different” have ended up in a smoldering pile of toxic waste.
