

The Bottom’s Not In——Why This Market Is Dumber Than A Mule
Courtesy of David Stockman
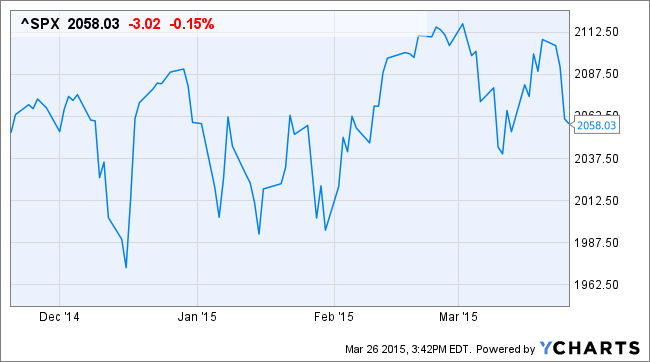
They were trying to put in a bottom—–again! The sell-off earlier this week amounted to the sixth sizeable “dip” since November 20—-so the market’s ingrained reflex was back at work all afternoon, trying to scoop up the “bargains”.
But the roundtrip to the flat-line shown below is not a classic “wall of worry” and its not a “bottom” that’s being put in. This market is dumber than a mule, and the nation’s central bank and its counterparts around the world have made it so.
The plain truth is that six years of torrential money printing and worldwide ZIRP have not happened with impunity. On the one hand, massive, sustained and universal financial repression caused an artificial growth and investment boom in much of the world, especially China and the EM, which has now run out of steam and is visibly and rapidly cooling.
There is probably no better proxy for the global investment boom than the spot price of iron ore because it captures China’s massive infrastructure construction spree and the waves of mining, shipbuilding, steel-making and construction materials spending that it set off all over the world. But this huge tidal wave has now crested, leaving behind the worst of both worlds——cooling demand and still expanding supply.
For the first time since around 1980, China’s steel consumption is projected to fall in 2015——with demand slumping from 830 million tons last year toward 800 million tons, and that is just the beginning as China’s credit-fueled construction frenzy finally comes to a halt. In fact, during the boom that took iron ore prices from a historic level of around $20-30 per ton to a peak of nearly $200 in 2011, China’s iron and steel capacity grew like topsy. Production capacity expanded from about 200 million tons at the turn of the century to upwards of 1.1 billion tons at present.
Yet this year’s decline of demand to around 800 million tons does not begin to reflect the coming adjustment. That’s because there is still a residual component of one-time demand in that number that is in no way sustainable. Even if the pace is slackening, the Chinese are still building high-rise apartments which will remain empty and airports, roads, rails and bridges that are hideously redundant. Eventually that will end because even the red capitalist rulers in Beijing are terrified of China’s towering mountain of debt——$28 trillion and still rising by hundreds of billions every month.
Yet underneath this one-time explosion of demand for steel, aluminum, copper, concrete and the rest of the materials slate is something called sell-through demand. The latter reflects the sustainable level of demand for replacement of long-lived assets like bridges and shorter-term durables like cars and appliances. In the case of steel, that sustainable “sell through” demand level could be as low as 500-600 million tons or hardly half of China’s steel production capacity.
The emerging global deflation has already brought the spot price of iron ore under $60 per ton—-or back to where the latest credit-fueled boom cycle commenced in March 2009. The consequences of that are visible, among many other places, in Australia’s burgeoning depression and the slide of Brazil into its worst two-year economic slump since 1930-1931.

Iron Ore Spot Price (Any Origin) data by YCharts
Yet there is still a long way to go because of the investment cycle time lag: New capacity to mine, transport and deliver water-borne iron ore is still surging because it was ordered years ago when the global boom appeared to be endless. So not only will iron ore prices continue to erode at the commodity level; their plunge is also a proxy for a similar excess downstream capacity to make steel and the coming flood of surplus or “dumped” supplies on the global market.
Today Bloomberg had an excellent update on the imports flooding into the US owing to the strong dollar and China’s rapidly weakening internal demand. From a level of less than 50 million tons annually two years go, the run-rate of China’s fire-sale steel exports is already above 100 million tons and heading much higher. As shown in the graph below, this has already caused the domestic steel industry utilization rate to plunge, eliciting a rising tide of lay-offs, plant closures and steel company profit warnings.

And then the rolling adjustment will move downstream from steel to the fabrication and manufacturing industries. In short, there is an unprecedented global industrial deflation brewing that is the downside of the central bank driven boom. That is, we are now plunging into the crack-up phase of the great central bank monetary deformation. Indeed, the idea that the US is immune to this and that it has somehow decoupled from the global economy is downright farcical.
Perhaps that’s why yesterday’s extremely downbeat industrial order report came as such a shock to the talking heads. Self-evidently, they have been drinking the Fed’s Cool-Aid or they would have noticed long ago that we are not in any “recovery” worthy of the name. How could it be when real industrial orders are still 10% below their average pre-crisis level?
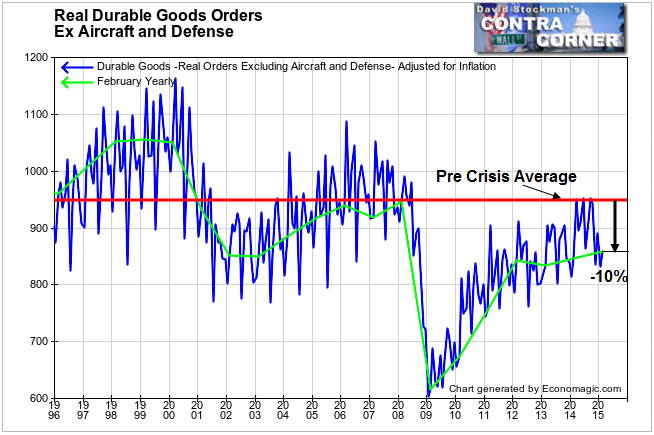
Real Durable Goods Orders Ex Aircraft and Defense
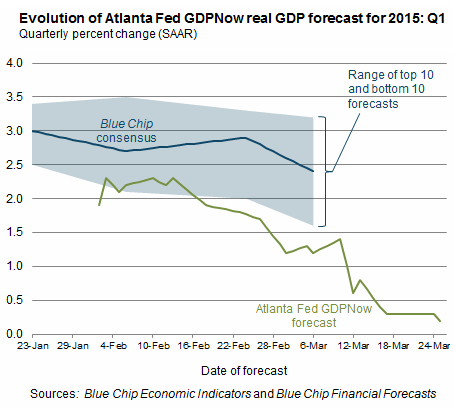
Needless to say, there is plenty more evidence where that came from. In fact, the Atlanta Fed’s so-called “nowcast” of GDP is essentially a running tabulation of the “in-coming” data that eventually flows into the GDP report. With yesterday’s latest iteration of data, the outlook for Q1 is now down to 0.2%.
And this is why there is a big financial storm coming. The Fed and other central banks are now out of dry powder and credibility. The only thing happening at this point is a currency race to the bottom. They have no capacity whatsoever to arrest the epochal deflation that is gathering force all around the planet.
So here’s the buy the dip history during which the central banks destroyed price discovery, short sellers and economic sanity itself. They rendered the markets as dumb as a mule, capable of nothing more than reflexively buying the dips.
It will take awhile, but eventually the robo-traders will desist, the day-traders will be broke and the fast money will get short—–once it becomes clear that “escape velocity” was a myth, the global recession has arrived and the central banks are firing blanks.
Then the bottom will be in, albeit a long way down from here.
