

Digesting Stock Gains
Courtesy of Wade of Investing Caffeine

Despite calls for “Sell in May, and go away,” the stock market as measured by both the Dow Jones Industrial and S&P 500 indexes grinded out a +1% gain during the month of May. For the year, the picture looks much the same…the Dow is up around +1% and the S&P 500 +2%. After gorging on gains of +30% in 2013 and +11% in 2014, it comes as no surprise to me that the S&P 500 is taking time to digest the gains. After eating any large pleasurable meal, there’s always a chance for some indigestion – just like last month. More specifically, the month of May ended as it did the previous six months…with a loss on the last trading day (-115 points). Providing some extra heartburn over the last 30 days were four separate 100+ point decline days. Realized fears of a Greek exit from the eurozone would no doubt have short-term traders reaching for some Tums antacid. Nevertheless, veteran investors understand this is par for the course, especially considering the outsized profits devoured in recent years.
The profits have been sweet, but not everyone has been at the table gobbling up the gains. And with success, always comes the skeptics, many of whom have been calling for a decline for years. This begs the question, “Are we in a stock bubble?” I think not.
Bubble Bites
Most asset bubbles are characterized by extreme investor/speculator euphoria. There are certainly small pockets of excitement percolating up in the stock market, but nothing like we experienced in the most recent burstings of the 2000 technology and 2006-07 housing bubbles. Yes, housing has steadily improved post the housing crash, but does this look like a housing bubble? (see New Home Sales chart)

Source: Dr. Ed’s Blog
Another characteristic of a typical asset bubble is rabid buying. However, when it comes to the investor fund flows into the U.S. stock market, we are seeing the exact opposite…money is getting sucked out of stocks like a Hoover vacuum cleaner. Over the last eight or so years, there has been almost -$700 billion that has hemorrhaged out of domestic equity funds – actions tend to speak louder than words (see chart below):
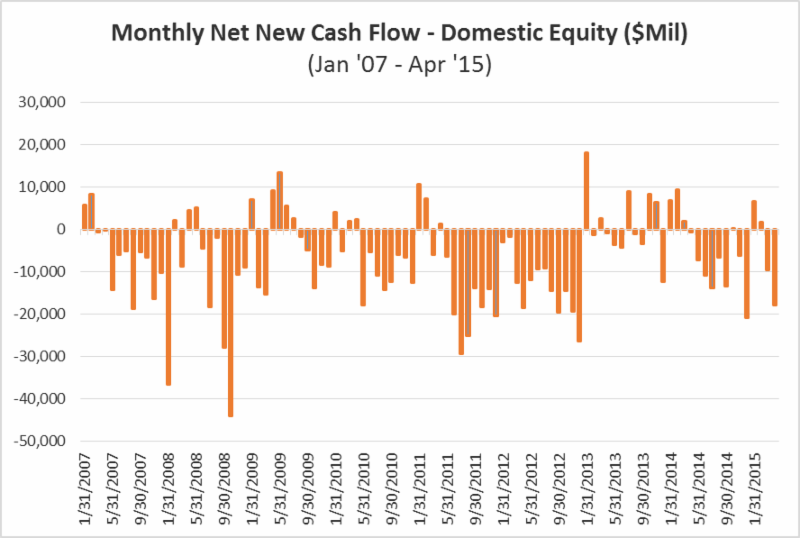
Source: Investment Company Institute (ICI)
The shift to Exchange Traded Funds (ETFs) offered by the likes of iShares and Vanguard doesn’t explain the exodus of cash because ETFs such as S&P 500 SPDR ETF (SPY) are suffering dramatically too. SPY has drained about -$17 billion alone over the last year and a half.
 With money flooding out of these stock funds, how can stock prices move higher? Well, one short answer is that hundreds of billions of dollars in share buybacks and trillions in mergers and acquisitions activity (M&A) is contributing to the tide lifting all stock boats. Low interest rates and stimulative monetary policies by central banks around the globe are no doubt contributing to this positive trend. While the U.S. Federal Reserve has already begun reversing its loose monetary policies and has threatened to increase short-term interest rates, by any objective standard, interest rates should remain at very supportive levels relative to historical benchmarks.
Besides housing and fund flows data, there are other unbiased sentiment indicators that indicate investors have not become universally Pollyannaish. Take for example the weekly AAII Sentiment Survey, which shows 73% of investors are currently Bearish and/or Neutral – significantly higher than historical averages.
The Consumer Confidence dataset also shows that not everyone is wearing rose-colored glasses. Looking back over the last five decades, you can see the current readings are hovering around the historical averages – nowhere near the bubblicious 2000 peak (~50% below).
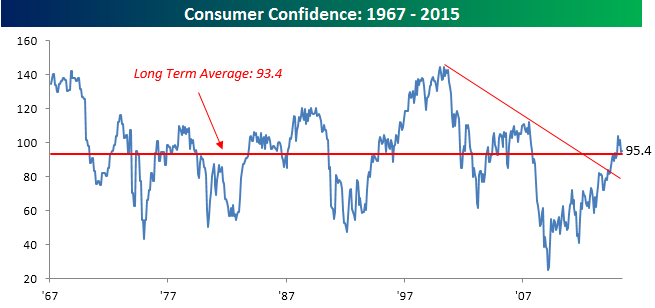
Source: Bespoke
Recession Reservations
Even if you’re convinced there is no imminent stock market bubble bursting, many of the same skeptics (and others) feel we’re on the verge of a recession – I’ve been writing about many of them since 2009. You could choke on an endless number of economic indicators, but on the common sense side of the economic equation, typically rising unemployment is a good barometer for any potentially looming recession. Here’s the unemployment rate we’re looking at now (with shaded periods indicating prior recessions):
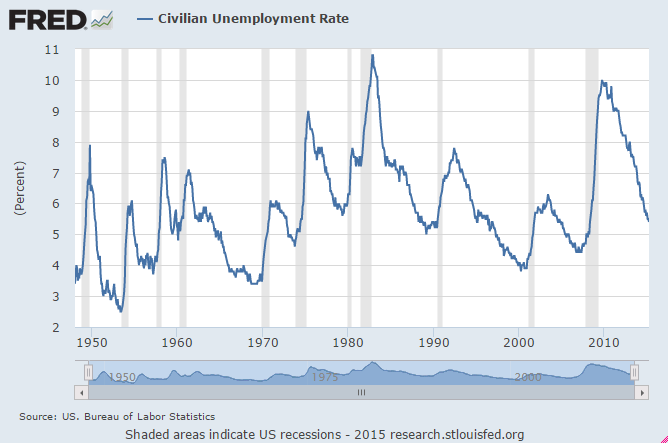
As you can see, the recent 5.4% unemployment rate is still moving on a downward, positive trajectory. By most peoples’ estimation, because this has been the slowest recovery since World War II, there is still plenty of labor slack in the market to keep hiring going.
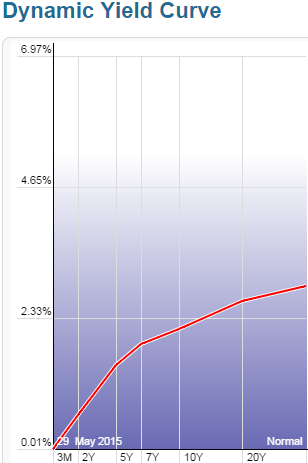
An even better leading indicator for future recessions has been the slope of the yield curve. A yield curve plots interest rate yields of similar bonds across a range of periods (e.g., three-month bill, six-month bill, one-year bill, two-year note, five-year note, 10-year note and 30-year bond). Traditionally, as short-term interest rates move higher, this phenomenon tends to flatten the yield curve, and eventually inverts the yield curve (i.e., short-term interest rates are higher than long-term interest rates). Over the last few decades, when the yield curve became inverted, it was an excellent leading indicator of a pending recession (click here and select “Animate” to see amazing interactive yield curve graph). Fortunately for the bulls, there is no sign of an inverted yield curve – 30-year rates remain significantly higher than short-term rates (see chart below).
Stock market skeptics continue to rationalize the record high stock prices by pointing to the artificially induced Federal Reserve money printing buying binge. It is true that the buffet of gains is not sustainable at the same pace as has been experienced over the last six years. As we continue to move closer to full employment in this economic cycle, the rapid accumulated wealth will need to be digested at a more responsible rate. An unexpected Greek exit from the EU or spike in interest rates could cause a short-term stomach ache, but until many of the previously mentioned indicators reach dangerous levels, please pass the gravy.
Wade W. Slome, CFA, CFP®
Plan. Invest. Prosper.
DISCLOSURE: Sidoxia Capital Management (SCM) and some of its clients hold positions in SPY and other certain exchange traded funds (ETFs), but at the time of publishing, SCM had no direct position in any other security referenced in this article. No information accessed through the Investing Caffeine (IC) website constitutes investment, financial, legal, tax or other advice nor is to be relied on in making an investment or other decision. Please read disclosure language on IC Contact page.
This article is an excerpt from a previously released Sidoxia Capital Management complementary newsletter (June 1, 2015). Subscribe on the right side of Sidoxia's home page.