

Drought Surrounding Last Stock Market High May Be A Warning
Courtesy of Dana Lyons

50-day “droughts” before and after a 52-week high in the Dow Jones Industrial Average have marked several major tops.
It has now been 64 days since the last 52-week high in the Dow Jones Industrial Average (DJIA) on May 19. While that may seem like an eternity in the context of the past 2.5 years, it’s not at all unusual in the grand scheme of things. However, what did have us thinking “hmmm” is the fact that there was also an extended period of time – 53 days to be exact – prior to the DJIA’s high on May 18 when the index was unable to score a new high. As it turns out, such droughts prior to and subsequent to a DJIA 52-week high have been unusual. And, as it turns out, such occurrences have often come at inauspicious times in the market cycle.
Specifically, we looked at times when the Dow Jones Industrial Average made 1 or more new 52-week highs within a 7-day span – but no other 52-week highs during the 50 days preceding or following that 7-day span. As it turns out, the current instance is one of 11 unique examples going back to 1960.
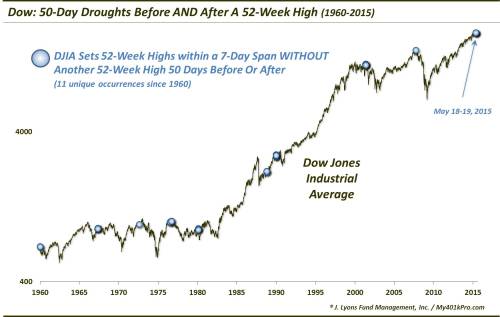
A glance at the dates (dots) on the chart tell you that several of the occurrences came near tops in the DJIA of some significance, including the last 2 cyclical tops. These are the months encompassing all unique signals since 1960:
- January 1960: Intermediate-term top, held for 14 months
- May 1967
- August 1972: Preceded cyclical top by 4 months, which held for 10 years
- July 1976: See next line
- September 1976: Cyclical top, held for 5 years
- February 1980
- October 1988
- January 1990: Intermediate-term top, temporarily surpassed during the summer but otherwise held for 13 months
- May 2001: Cyclical top, held for 5 years
- October 2007: Cyclical top, held for 5.5 years
- May 2015: ?
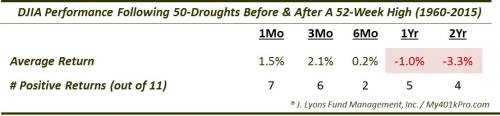
As you can see, while the record is not unanimously bad, it certainly does not present a favorable risk/reward proposition. In total, here is the performance of the DJIA following all occurrences. You can see the negative manifestation of the timing of these events the further out you go on the return table. FYI, the return figures are calculated as of 50 days following the last 52-week high (in our present situation, that would be from July 30, i.e., 50 days after May 19).
Is this development – a 50-day drought before and after the DJIA’s last 52-week high – something to worry about? According to many of the prior occurrences, the answer is “yes”, particularly on a longer-term time frame. As there are only 10 other occurrences over the past 55 years with which to judge, some may argue the historical proximity of many of the occurrences near significant tops is random, statistically speaking. That may be the case. However, one can come to their own conclusion regarding the study. In our view, in combination with many other concerns out there, this is another red flag for the longer-term prospects of the equity market.
* * *
More from Dana Lyons, JLFMI and My401kPro.