

Courtesy of Lee Adler of Wall Street Examiner
NAR data on housing sales showed the largest July decline since 2011, cutting the annual sales volume growth rate by 47% since March. However, while the growth rate is slowing, total sales volume was the heaviest for July since the peak of the housing bubble in 2005. Heavy but declining volume is a warning sign that you should heed.
Using the monthly seasonal adjustment error annualized, the Wall Street Journal and other mainstream outlets reported a 0.5% rise in July sales. In fact, using actual, not seasonally adjusted data, July sales fell by 11.5%. Sales always decline from June to July, but this July posted the second worst July performance since the housing crash. That contributed to the annual growth rate dropping from +13.5% in March to +7.2% in July.
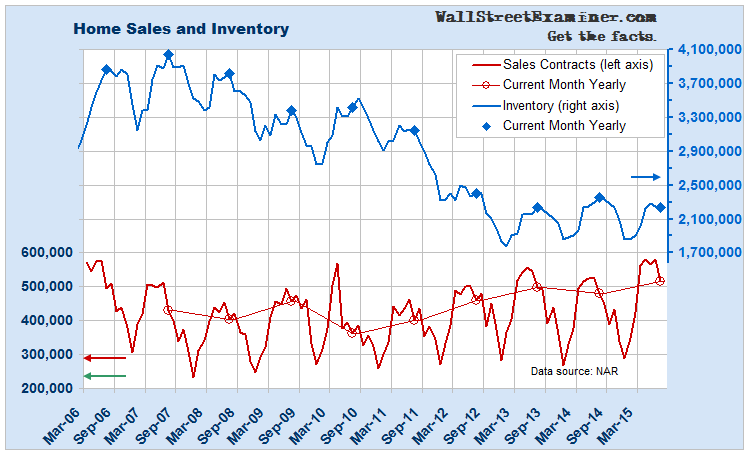
Housing Sales and Inventory
The fact that sales are slowing from bubble levels could be an early warning that the current version of the housing bubble is peaking. As house prices inflate and household incomes stagnate, affordability issues are beginning to have an impact in many markets. The market can ill afford any increase in mortgage rates. We saw evidence of that when the contract fallout rate spiked in April when rates briefly shot higher before settling back in ensuing months. Another rise in rates that sticks should be marked by another sharp increase in sales contracts that fail to go to closing.
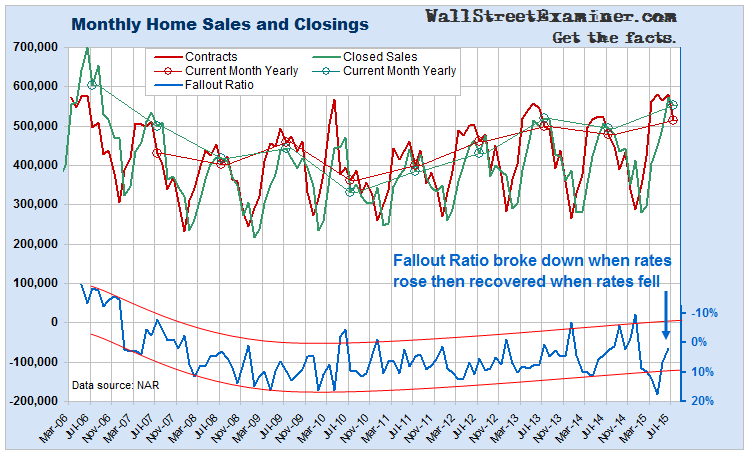
Monthly Housing Sales and Closings
Do you believe that liquidity moves markets? Then click here to learn how you can follow the money.