

Courtesy of Dana Lyons
Pullback in Margin Debt is healthy… unless it signifies the start of a larger decline.
In our post yesterday on household stock investment, we discussed what we call “background indicators”. These various investment metrics describe the longer-term conditions in the marketplace, but are not catalysts themselves. Thus, we consider them to be measures of potential risk should a catalyst come along to trigger a decline. In that case, the potential risk begins to manifest itself in actual risk. Considering it is near its all-time highs, we consider household stock investment to carry significant potential risk. Another background indicator signaling the same is NYSE margin debt.
Margin debt refers to the amount of money borrowed for the purposes of leveraging a stock position. The higher the level of margin debt, the more leverage in the system – and the greater the amount of potential risk. As of April this year, NYSE margin debt was at an all-time high at more than $500 billion. Over the past few months, the level has moderated a bit. After August’s market rout, margin debt sat at $473 billion, down 6.7% from the highs.
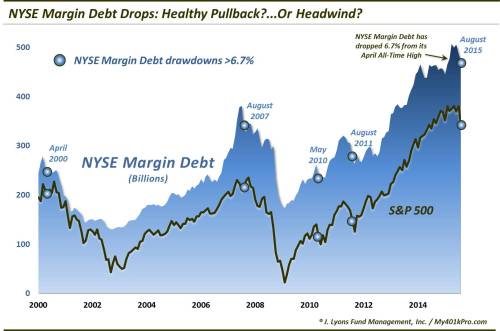
So is this a healthy pullback in potential risk? Or is it a beginning of a larger trend whereby more potential risk will become actualized risk? There is no way to know for sure, however, there have been a few similar declines in margin debt in the past 15 years. Specifically, since 1999, NYSE margin debt has seen a drawdown from its high of at least 6.7% on 4 other occasions
- April 2000
- August 2007
- May 2010
- August 2011
Obviously the first two instances saw the pullback morph into substantial, longer-term retrenchments, coinciding with cyclical bear markets in stocks. The other two occurrences, while coinciding with painful stock market pullbacks at the time, did not lead to a longer retrenchment in margin debt. And, in fact,by the time we knew what margin debt had done in May 2010 and August 2011, the correction in stocks was almost over.
There are obvious similarities between the 2010 and 2011 instances with our current situation, especially 2011. So it is entirely possible that the current market pullback has almost run its course. However, there are also differences. In 2010 and 2011, neither the stock market nor margin debt were at all-time highs. They were in 2000 and 2007, however.
So which is it? We can’t know but there is one thing that may be relevant to keep in mind. Considering the elevated near-all-time high readings, if it is the beginning of a larger decline in margin debt, the resulting move in margin debt and in stocks will be much larger than that of a mere short-term correction. Thus, while the odds of each outcome may be equal (as far as we know), the consequences of each are much different.
In any bull market, certain excesses are built up during its duration. The build up of these excesses, in metrics like margin debt, can serve as a tremendous tailwind for the market…as long as they continue to rise. However, when the music stops and the market declines, these tailwinds become headwinds. This is particularly true of margin debt as margin selling necessarily exacerbates the damage in a large decline.
We do not know for sure if the recent margin debt retrenchment is the beginning of a longer trend. However, given the record high levels it recently achieved, should a longer, more serious decline in the stock market be starting, the large potential risk represented by record margin debt levels will turn into large actual risk.
* * *
More from Dana Lyons, JLFMI and My401kPro.