

U.S. Stocks Facing Their Biggest Test In 8 Years?
Courtesy of Dana Lyons

Broad-based Value Line Composite testing mega-critical level.
The Value Line Geometric Composite (VLG) is an unweighted average of roughly 1700 U.S. stocks. This makes it, in our view, the most accurate index in instructing investors of the true state of the U.S. stock “market”. And since studies have shown that some 70%-80% of stocks go the way of the market, the VLG is our main focus among all the indexes. That is why on August 28, we highlighted the significance of the area in the mid-430′s on the VLG chart where the index held during the late August mini-crash.
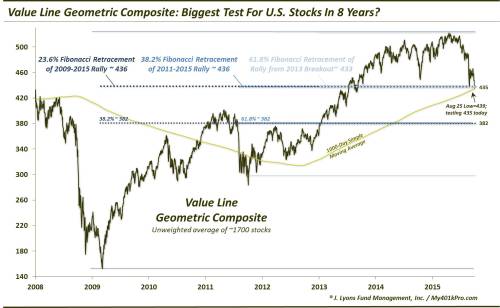
To reiterate the significance of the mid-430′s level, it marks a confluence of Fibonacci Retracement levels drawn from the important lows since 2009 to the April high. Specifically, we find these 3 levels all within close proximity:
- The 23.6% Fibonacci Retracement of the 2009-2015 Rally ~436
- The 38.2% Fibonacci Retracement of the 2011-2015 Rally ~436
- The 61.8% Fibonacci Retracement of the Rally from the 2013 Breakout Point to the April High ~433
- Additionally, the 1000-day simple moving average (approximately, the 200-week moving average) lies at 435.
We have mentioned before that we have increased confidence in the validity of a chart level when multiple analyses line up nearby there. That is certainly the case here. Furthermore, our confidence is heightened when the level is tested – and it holds – as the Value Line Composite did in late August, bottoming at 439 on August 25. That validates the level as important as prices have shown they “respect” the level. Furthermore, as we stated in the August 28 post:
It also presents us with a line in the sand, should the index eventually go on to “test” the 430′s level (a development that would not at all surprise us). We have a reference point to generally orient us bullishly should the level hold or quickly recover a break – and bearishly should the level fail.
That brings us to today’s Chart Of The Day and post. The mid-430′s level is back in full focus as the Value Line Geometric Composite is knee deep in re-test mode, closing at 432.32 today.
Here is a BIG picture view of the importance of this level on the chart as the VLG is testing it right now.
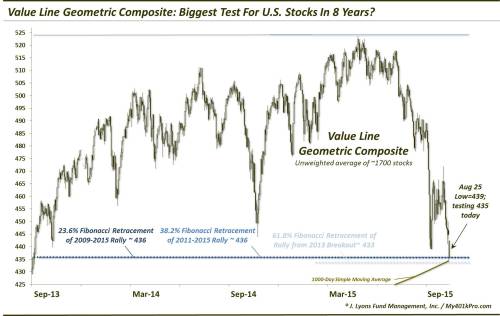
Here’s a closer look:
So we have touched on the analysis that makes this level so important. But why is it the biggest test in 8 years? First of all, it would establish an unambiguous lower low on the chart below last October’s lows. Furthermore, it would create a formidable resistance level here for any future rally attempts.
Secondly, a failure here would knock out the first major Fibonacci Retracement level of the post-2009 rally. And while it does not necessarily guarantee an end to the cyclical bull market, it certainly puts a significant dent in it.
On a shorter-term basis, the break of the 61.8% Fibonacci Retracement of the rally since the VLG’s 2013 breakout would be a serious indictment. It would leave the index open to possibly (or, likely) retracing the entire rally since the 2013 breakout. A breakout that cannot sustain enough momentum to avoid an entire retracement is a breakout that is not long for this world (no pun intended).
Lastly, the break of the 1000-day moving average would be an unwelcomed development as well. While moving averages are prone to whiplashes, the 1000-day does not see prices cross it too often. In fact, since 2000, the VLG has dropped below the 1000-day moving average on just 4 occasions. 2 of those led to cyclical bear markets, in 2000 and 2008. Again, such a cross below would not guarantee a cyclical bear market has begun. It may turn out to be a short-term whiplash, as in August 2004…or a slightly less-short-term whiplash, as in August 2011. However, the fact that this broad, unweighted index could drop below such a long-term moving average is indicative of real weakness and vulnerability among a great many stocks throughout the U.S. equity market.
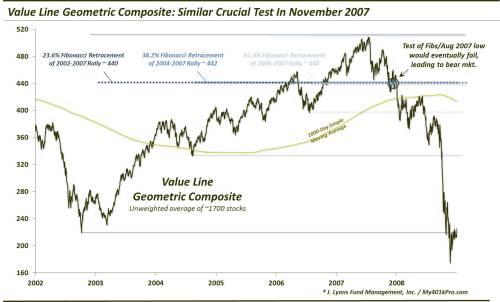
The last time we saw such an important test by this index was 8 years ago. After holding a key level (near 440 – almost the same level as today!) in an August 2007 selloff, the VLG was back testing the level again in November. Similar to today’s set of circumstances, that level marked several major Fibonacci Retracement levels from key points in the 2002-2007 cyclical bull market:
- The 23.6% Fibonacci Retracement of the 2002-2007 Rally ~440
- The 38.2% Fibonacci Retracement of the 2004-2007 Rally ~442
- The 61.8% Fibonacci Retracement of the 2006-2007 Rally ~440
In 2007, the VLG struggled with the test, giving way immediately before rallying back up above the 440 level for a few weeks. However, that proved short-lived as the index eventually dropped below that level in early January…for good.
Does the 2007 failure guarantee that this similar setup will also fail? Obviously not – and we are not trying to suggest that. However, we do view this area as being of the utmost importance for the U.S. stock market. A successful hold here and the prospects for resuming the bull market are improved significantly. A failure would open the downside in the VLG to the next key Fibonacci cluster near 380, or another 12% lower. Additionally, the sustainability of the post-2009 bull market would be cast in further doubt.
We don’t label many spots on U.S. equity charts as “make or break” for the broad market. However, the mid-430′s area on the Value Line Geometric Composite is as critical a level as we can give you in any index or security. The VLG’s grade on this test – pass or fail – could very well go a long way in determining whether the bulls or bears have the upper hand in the longer-term.
______
More from Dana Lyons, JLFMI and My401kPro.
The commentary included in this blog is provided for informational purposes only. It does not constitute a recommendation to invest in any specific investment product or service. Proper due diligence should be performed before investing in any investment vehicle. There is a risk of loss involved in all investments.