

2011 Redux- We’re About To Find Out If This Time Is Different
Courtesy of Lee Adler, Wall Street Examiner
I commented about the 2011 comparison (reproduced below) in the October 24 Market Update Pro Trader report.
We’re about to find out if this time is different. [If you are an active technical trader, follow this saga along with me in the Pro Trader Daily or Weekly service. Publication will resume on Tuesday.]
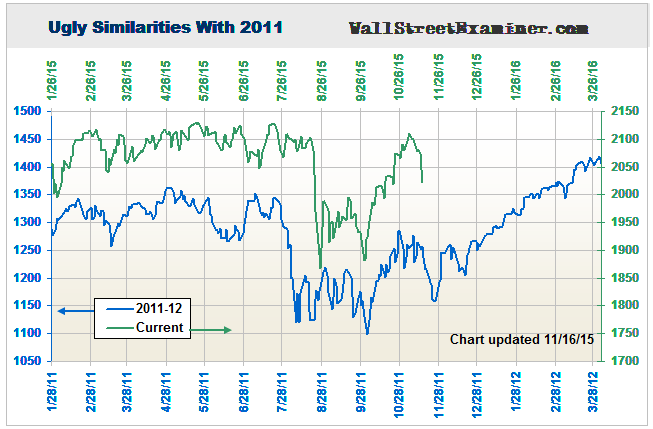
10/24/15 – There are strong similarities between today’s market pattern and the 2011 market (see chart posted on the website and at the end of this report). It’s definitely a 4 year cycle echo, but the big questions are whether this is really a new 4 year cycle upleg, and if it is, will this upleg look like the one that followed the 2011 launch.
The most significant difference between today and then is that in 2011 the Fed announced that it would begin reinvesting the proceeds of MBS paydowns, which was a direct market stimulant. Today, the Fed has continued the MBS reinvestments, but the amounts are far smaller than in 2011. The Fed mostly now sits on its hands while the BoJ and ECB do the pumping (covered in the Macroliquidity reports).
From the perspective of intermediate and longer term technical indicators, today’s patterns also look very similar to the October 2011 pattern, although the current market did not reach as oversold a level as that selloff did. And while there are no signals indicating a new bull market yet today, in 2011 those signals did not start triggering until the tail end of the October move, the first being 10-12 month cycle momentum. Today, 10-12 month cycle momentum has flashed a buy signal on the weekly chart, but not quite on the daily chart. It should do so this week.
In 2011, 3-4 year cycle momentum was borderline through most of November, not triggering a clear buy signal until the end of the month. Today, 3-4 year cycle momentum is on the cusp of a buy signal. A trend resistance breakout did not come until December 2011. Today’s market has reached a similar trendline. So the market’s behavior over the next month will either continue the 2011 echo and signal a new bull phase, or it will break off, telling us that this time is different. If we start to see more momentum buy signals at the end of the week ahead, then it we’re likely to see a string of higher highs in 2016. If however, the SPX gets driven back from here, then the bear market signals that we saw over the past several months may still come to fruition next year.