

Courtesy of Dana Lyons
 After failed breakouts earlier in the year, the charts of the Asian Tiger Cub markets suggest more trouble may lie ahead.
We’ve mentioned several times how price action often times can “predict” the news. That is, the chart of a particular security, index or market may suggest a likely path for prices – bullish or bearish – long before any news comes out and is assigned as the ex post facto cause of the move. Therefore, scanning the charts of various markets can, at times, give us a head’s up on a potential source of positive or negative “news” before the market hits the mainstream radar. Such may be the case currently in the Asian Tiger Cub markets – in a negative way.
In August, we revealed the extensive damage being done in the stock markets of the Asian “Tiger Cubs”, i.e., Indonesia, Malaysia, the Philippines and Thailand. That wasn’t the case earlier in the year as we indicated in that post:
We posted several pieces early in the year on the various emerging markets…as they began the year in promising fashion. While Malaysia was the laggard of the group, Indonesia and the Philippines experienced nice looking breakouts while Thailand appeared poised to do the same. We even suggested that they looked to be in the running early on for “stock market of the year”.
In that August post, introduced the Asian Tiger Cub Composite, an equal-weight composite of the 4 markets. We wrote:
Similar to its components, the Composite started the year out strongly. In late January, the Composite broke above its previous high closing levels from 2013 and 2014 and into all-time high territory. While the breakout looked promising, it did not stick. After reaching its peak in early April, the Composite failed to hold above the previous highs. Recently, it has accelerated its move to the downside. As of today, the Composite is down about 15% from its April highs and sitting at an 18-month low.
We did note that the individual country markets were approaching longer-term potential support areas that could produce a bounce. Indeed the markets bounced soon afterward.
As it is often said (including, by us), a lot can be determined by judging the “quality” of a bounce. That is, if prices recover robustly and quickly, odds are good that the decline was perhaps a counter-trend move and has run its course. However, if the recovery is a shallow one that fails to approach the prior highs, odds are good that it is the bounce that is counter-trend and that further declines are likely to come. In our view, the latter would be an appropriate description of the bounce in the Asian Tiger Cubs since August.
Here is the updated chart of the Asian Tiger Cub Composite.
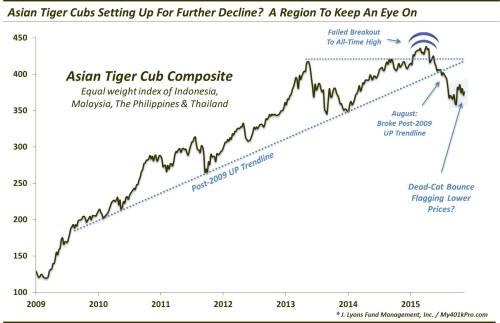
As the chart shows, after the failed breakout to all-time highs earlier in the year, the Composite broke its post-2009 UP trendline in August, preceding a precipitous decline. Unlike some other markets around the globe, the Composite’s bounce since has been feeble, at best, barely recovering a quarter of the decline. This suggests that the breakdown was a significant event and further declines are likely ahead, eventually.
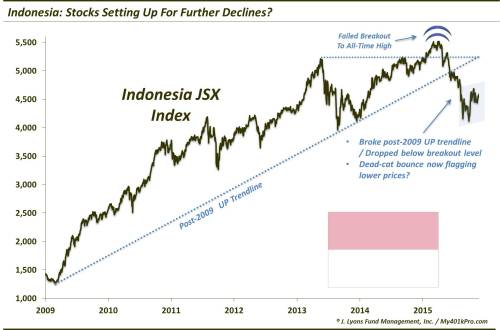
A look at the individual countries reveals, not surprisingly, a similar picture. After breaking out to all-time highs earlier in the year, the Indonesian JSX Index was unable to hold above its prior peaks. Subsequently, the index broke its post-2009 UP trendline in August, also preceding a precipitous decline. Its bounce too has been lackluster.
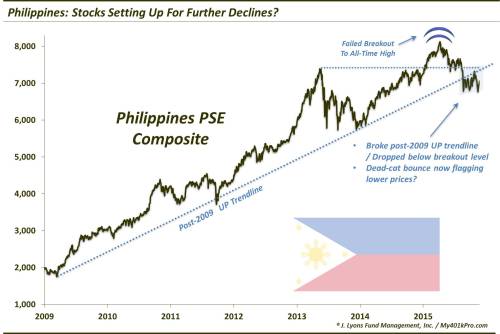
Likewise, the Philippines PSE Composite suffered a failed breakout to all-time highs earlier in the year, followed by a break of its post-2009 UP trendline in August. Its bounce since has been especially weak.
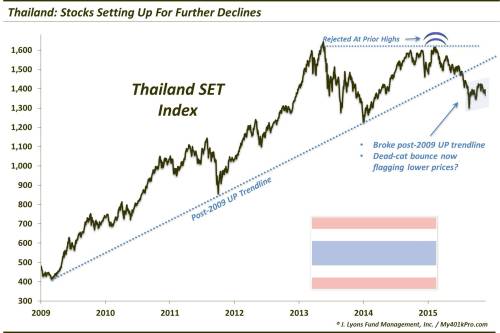
Next we see the Thailand SET Index., The SET failed to break out to all-time highs earlier in the year, instead rejected by highs from 2013 and the mid-1990′s. It also has since broken its post-2009 UP trendline. Its weak bounce since is on par with that of the Philippines.
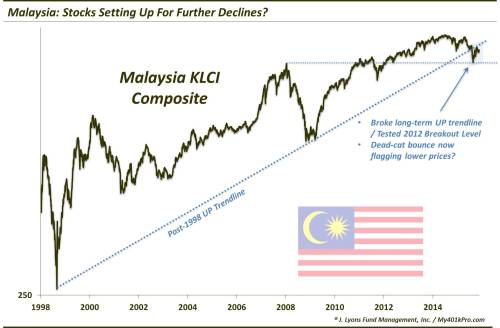
Lastly, the Malaysia KLCI Composite may be a bit more positive or negative depending on the perspective. The KLCI was able to break out to new highs back in 2012. However, after a nice run, it dropped back down in 2014, breaking below its post-2009 UP trendline. Even worse, during the August decline, the composite broke its post-1998 UP trendline, on a log scale. The only positive here is that it was able, for now, to hold its 2012 breakout levels. We say “for now” because it too has mounted only a weak bounce thus far.
As you can see, the stock markets of those countries known as the Asian Tiger Cubs suffered extensive damage in the August global equity decline. Each has broken at least its post-2009 uptrend. Potentially making matters worse, the breakdowns come after several of the markets broke out to all-time highs earlier in the year. Just as troubling is the fact that their respective recoveries have been relatively anemic. While there may be room to move a bit higher in the near-term, these recent developments suggest that greater eventual declines are likely ahead for these markets.
If that comes to pass, expect to hear news waves coming from that region of the world. Whether such news will be related to slow economic growth, China-related concerns, currency issues, etc., we don’t know. But that is the point. The region is well under the radar at the moment in terms of potential trouble spots. However, the charts may suggest otherwise.
* * *
More from Dana Lyons, JLFMI and My401kPro.
Picture via Pixabay.