

Courtesy of Dana Lyons
The correction in the equity markets has brought the S&P 500 down close to a confluence of key technical levels.
People ask us all the time what we view as the important “levels” in the stock market, e.g., “what is our target level for the Dow?” or “what level will put an end to the correction?”. To be honest, while we do have our areas on the various charts that we view as significant, we are less focused on price levels than we are on the behavior of various market indicators and investors. Levels can be helpful, but sometimes prices overshoot what they “should” and sometimes they don’t quite make it “there”. That’s why we rely on a set of indicators based on market internals, momentum, investor positioning, etc. to help guide our investment posture, i.e., aggressive, defensive, etc.
That said, as I mentioned, we do view certain levels on a chart as significant if prices do happen to reach, or breach, them. And since A) people are most interested in the S&P 500 and B) that index is approaching some potentially key levels, we thought we would present it as our Chart Of The Day.
One thing of note that we have mentioned several times before is that, of all the securities and indices, etc. that one wants to chart technically, the S&P 500 is one of the most unreliable. We have found that typically, the degree of adherence to technical levels is inversely correlated to the number of participants trading it. That is, the more people attempting to technically trade a price series, the less apt it is to conform to traditional technical analysis.
This is not a scientific conclusion but rather an observation of ours. But it does make sense because A) the more competition there is, the more difficult it will be to win, and B) the more participants there are watching the same thing, the more likely it will be that HFT’s, computers or large institutions will be “gaming” that “thing”. And perhaps no instrument has more eyes on it than the S&P 500. That means it is a relatively difficult thing to successfully trade based on traditional technical analysis. Yet, for some reason, everybody feels the need to be involved with it.
With all that said, here are some levels of potential importance, in our view, that are fast approaching based on the S&P 500′s current selloff. Again, the levels are not as precisely aligned as they are on some indices (e.g., the Value Line Geometric Composite), because there are too many eyeballs on it. However, the following 5 significant levels are generally within the same vicinity between 1748-1790, making it a key confluence of potential support.
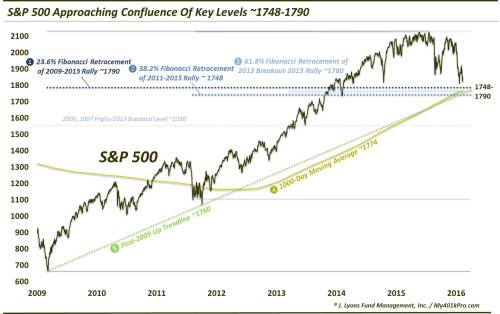
- 23.6% Fibonacci Retracement of 2009-2015 Rally ~1790
- 38.2% Fibonacci Retracement of 2011-2015 Rally ~ 1748
- 61.8% Fibonacci Retracement of 2013 Breakout-2015 Rally ~1780
- 1000-Day Moving Average ~1774
- Post-2009 Up Trendline ~1760
You may be thinking that, if the S&P 500 reaches these levels, it will mean that the January 20 low will have been breached. How could the index be expected to hold any nearby levels then? Remember that there are tons of folks watching for a break of that January low as a bearish signal. While we are not saying a breach of the low would be a positive, remember that there is a ton of money watching the “watchers” with the goal of manipulating their traditional expectations. That may be less than clear so just remember, if you’re trading the S&P 500 or any other heavily traded instrument, do not be surprised by the unexpected.
Will these levels pan out as support? Will they even be reached? We have no idea. That’s why we focus on other metrics to inform our investment decisions. However, we would expect this confluence of levels to at least offer an attempt at support.
* * *
More from Dana Lyons, JLFMI and My401kPro.