

Courtesy of Dana Lyons
 With stocks’ steady drift through all-time high territory, investors’ relative near-term volatility expectations have plummeted to near record lows.
One of the hallmarks of the post-February rally in stocks has been a healthy dose of investor skepticism and anxiety. But for brief periods, e.g., towards the end of April, investors have been slow to embrace the move. Such disbelief is one trait that has helped prolong the intermediate-term rally, now more than 5 months old. In recent weeks, we have mentioned in posts and interviews that perhaps the one thing that will usher in greater enthusiasm on the part of investors is a new high in the major averages. Perversely, that was one potential development, we surmised, that may shift sentiment far enough to the bullish side that it could finally place the intermediate-term rally in jeopardy. That scenario appears to be possibly playing out.
Why do we say that? Well, one piece of evidence suggesting a new-found elevated level of investor complacency comes from the volatility market. One way to judge investor comfort or anxiety is to look at the level of expected stock market volatility via instruments such as the S&P 500 Volatility Index, or VIX. Presently, the VIX is plumbing one of its lowest levels since 2007, so investors are displaying very low expectations for stock market volatility at the moment.
Another way of using volatility to measure the extent of investor nervousness is by comparing near-term volatility expectations versus those farther out. For example, the VIX is actually the 1-month volatility index. Meanwhile, the VXV is the 3-month volatility index. Typically, the VIX will be lower than the VXV as there is less time in the near-term for volatility rises to occur. When investors get especially nervous (usually during a selloff), near-term volatility expectations can actually rise above those farther out, i.e., the VIX/VXV ratio rises above 1.00, or 100%. Conversely, during times of complacency, the VIX can drop to relatively low levels versus the VXV, historically under 0.80, or 80%. That’s where the VIX/VXV ratio currently finds itself – and then some.
As of yesterday, July 19, the ratio stood at 76.0%, one of the most complacent readings since the inception of the VXV in 2007.
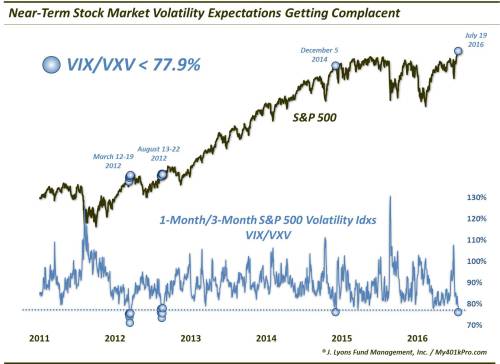
As the chart reveals, this was just the 14th reading under 77.9% since 2007 (with none coming prior to 2012). The previous occurrences were clustered in March and August of 2012 and December 5, 2014. So how did investors fare following such extreme displays of complacency? As you may have guessed, the complacency was not well-timed.
Here is the S&P 500′s performance following the previous 13 days showing a VIX/VXV reading under 77.9%:
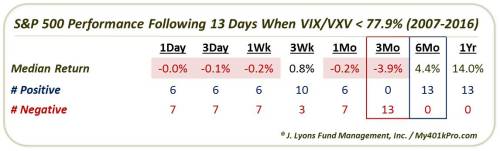
As you can see, in the short-term, there was little edge as returns in the S&P 500 were a toss-up. Therefore, while complacency may not be advised at this juncture in the market, perhaps there is no reason to panic either. After that, things get interesting.
At the 3 month mark, all 13 events were negative, with a median return of -3.9%. Perhaps that is the time frame in which to expect some market drawdowns. The 6-month and 1-year results, however, would suggest that short sellers best not overstay their posture. That’s because all 13 events would reverse their losses and show positive returns over those 2 time frames.
We’ll remind you that the 13 precedents were clustered around just 3 periods. Therefore, the sample size is even smaller than “13″ would suggest. However, unanimous is always an intriguing result so we would not necessarily dismiss either the intermediate-term weakness nor the longer-term strength.
Is this data point enough to override the constructive, post-breakout price structure in the S&P 500? We’d say, no. Is it enough to counteract ongoing positive breadth conditions? No, again. However, we will say that this measure of investor complacency is enough, in the intermediate-term, to at least remove sentiment from the “tailwind” category for stocks.
* * *
More from Dana Lyons, JLFMI and My401kPro.