

Are Stocks Coiling For Another Big Move?
Courtesy of Dana Lyons

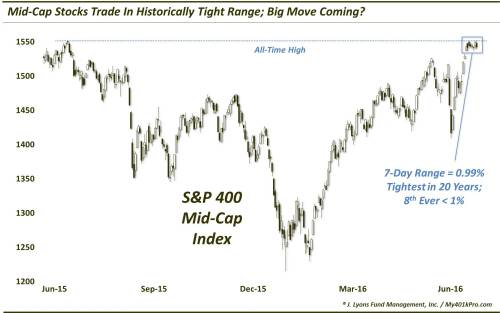
The S&P Mid-Cap Index is trading in the tightest 8-day range in over 20 years; is a big move imminent?
Yesterday, we wrote about the Dow Jones Industrial Average’s rare streak of 7 consecutive all-time highs since its long-awaited breakout. However, scanning the broad equity landscape, it appears that consolidation has been more the norm since the market’s last big up day on July 12. This consolidation is demonstrated by the S&P 400 Mid-Cap Index as clearly as any space. Specifically, the 7-day range in the index spans less than 1 percent for just the 8th time ever. And, at precisely 1.00%, the 8-day range is the narrowest in more than 20 years. In fact, all of the historically tighter ranges occurred in the low-volatility early to mid-1990′s period.
So what are the implications of this tight range? Well, it is generally thought that exceptionally tight ranges lead to out-sized moves once the range is broken. The notion is that the action is akin to a coiled spring that, when released, expends its considerable pent-up energy. And, generally, we have found that to be the case with breakouts from similar ranges. However, it also depends on the type of environment we are in as well.
From 1992-1995, for example, the daily average true range in the S&P 400 averaged about 0.65%, an exceptionally low level. Thus, we should not be surprised to see that most of the historically tight trading ranges took place during that period. We also should not be surprised to see that the tight ranges of that era did not always lead to out-sized moves.
On the other hand the average true range during past 4 years has averaged around 1.30%, or about double that of the early-1990′s period. Therefore, when we see an unusually tight range like we are seeing now, it is not unreasonable to expect a sizable move once the tight range is broken.
Additionally, in an environment like the present, a tight range or consolidation is often representative of a continuation pattern. That is, eventually the pattern typically breaks, or continues, in the direction of the prior trend. That would be good news for the bulls as, in this case, the S&P 400 had been trending upward for the 2 weeks prior to the formation of the present range. Thus, if the continuation pattern unfolds “by the book”, the index should break out to the upside.
Furthering the potential good news for the bulls is the fact that, as seen in the above chart, the upper boundary of the current range happens to be the all-time high level in the S&P 400, first set last June. Thus, this index has done precisely what bulls should have been hoping for. It didn’t immediately break through the highs in a move that would have potentially created exhaustion and a failed breakout. Nor has it pulled back a substantial amount, making another rebound to the highs a difficult prospect. Rather, following a sharp advance to the previous highs, it has moved sideways, presumably in digestion of the advance and in preparation for the next up-leg.
Therefore, while we never want to anticipate a breakout, the setup looks pretty good for the bulls. If the consolidation is indeed a continuation pattern, the break to the upside would be to all-time high ground. And while it would not guarantee another extension of the rally, it as bullish an event as a market can hope for. Part of the reason, obviously, is because there is no resistance or supply at all-time highs.
One caveat or word of caution that we have repeated often is that markets do not seem to trade as reliably based off conventional charting techniques as they used to – i.e., they don’t do what they’re “supposed to”. We suspect it is due to the proliferation of chart and technical traders, aided by the abundant online and social media resources. The more participants there are, after all, the more difficult it is to win by using the same strategies.
Here is a case in point related to the present situation in the S&P 400. Prior to the past 8 days, the previously tightest range since 1995 occurred in mid-November of 2014. Like now, the S&P 400 had rallied sharply off of the mid-October lows, and up to the former highs set in July and September.
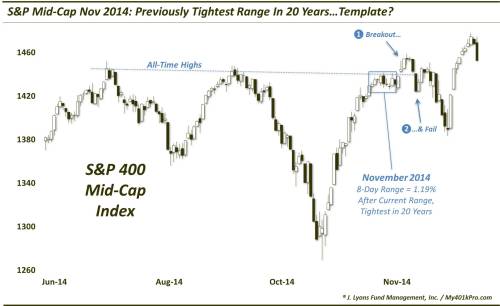
Following the tight consolidation, the index broke upward out of the range and “continued” its previous trend into new high ground. However, that breakout would last all of 4 days before failing, sending the S&P 400 down about 5%. It would recover soon after, but the “textbook” resolution to the continuation pattern did not exactly transpire. Therefore, just be careful not to let your guard down, especially when a setup looks too easy and obvious.
That said, the setup clearly appears to favor the bulls. A breakout here to all-time highs must be respected. And while perhaps the fact that the large-cap averages have already broken out may take some of the juice away from a breakout here, we have learned it’s best to focus on the merits of each individual price series.
In this case, mid-cap stocks look coiled and ready to make their (potentially bullish) move.
_____________
More from Dana Lyons, JLFMI and My401kPro.
The commentary included in this blog is provided for informational purposes only. It does not constitute a recommendation to invest in any specific investment product or service. Proper due diligence should be performed before investing in any investment vehicle. There is a risk of loss involved in all investments.