

Courtesy of Lance Roberts via Real Investment Advice
Would Another $4 Trillion In QE Work?
Just recently, David Reifschneider, deputy director of the division of research and statistics for the Federal Reserve board in Washington, D.C., released a staff working paper entitled “Gauging The Ability Of The FOMC To Respond To Future Recessions.”
The conclusion was simply this:
“Simulations of the FRB/US model of a severe recession suggest that large-scale asset purchases and forward guidance about the future path of the federal funds rate should be able to provide enough additional accommodation to fully compensate for a more limited [ability] to cut short-term interest rates in most, but probably not all, circumstances.”
In other words, the Federal Reserve is rapidly becoming aware they have become caught in a liquidity trap keeping them unable to raise interest rates sufficiently to reload that particular policy tool. As I have discussed in recent weeks, and below, there are an ever growing number of indications the U.S. economy is currently headed towards the next recession.
He compares three policy approaches to offset the next recession.
- Fed funds goes into negative territory but there is no breakdown in the structure of economic relationships.
- Fed funds returns to zero and keeps it there long enough for unemployment to return to baseline.
- Fed funds returns to zero and the FOMC augments it with additional $2-4 Trillion of QE and forward guidance.
In other words, the Fed is already factoring in a scenario in which a shock to the economy leads to additional QE of either $2 trillion, or in a worst case scenario, $4 trillion, effectively doubling the current size of the Fed’s balance sheet.
Here is the problem with the entire analysis. It assumes a normalized economic environment in which the Federal Reserve has several years before the next recession AND that large-scale asset purchases actually create economic growth. Both are likely faulty conclusions.
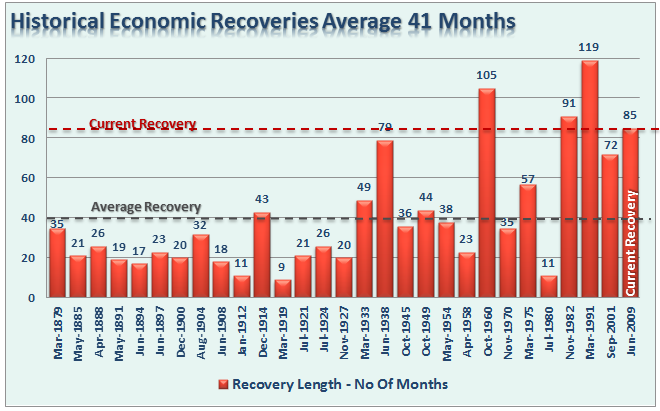
First, the current economic expansion is, by many measures, extremely long and is currently pushing the fourth longest expansion in history. Interestingly, this expansion is also the weakest of any expansion previously.
Secondly, is the issue of the success rate of QE on creating economic growth.
In the latter part of summer in 2010, then Fed Chairman Ben Bernanke launched a second QE program. The purpose of these programs were made very clear by Bernanke when he stated:
“Conventional monetary policy easing works by lowering market expectations for the future path of short-term interest rates, which, in turn, reduces the current level of longer-term interest rates and contributes to an easing in broader financial conditions. These changes, by reducing borrowing costs and raising asset prices, bolster household and business spending and thus increase economic activity.”
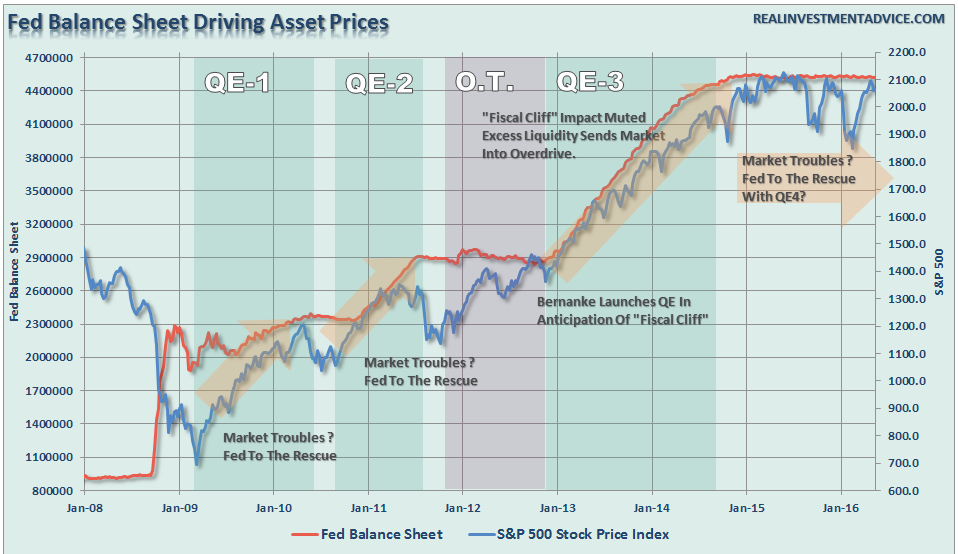
Well, we know for certain that ongoing Federal Reserve interventions have indeed boosted asset prices as shown below.
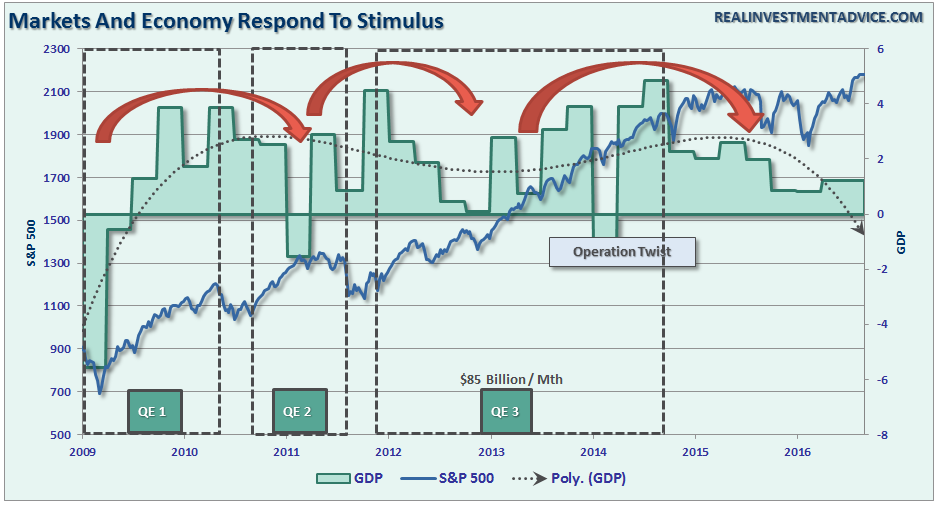
However, the question is did the elevation of asset prices actually translate into stronger economic growth. The answer is “yes” – each QE program was successful at pulling forward future consumption to provide a short-term boost to growth but the efficacy of each round of QE has declined. In other words, as shown in the chart below, each QE program must be larger to obtain weaker results.
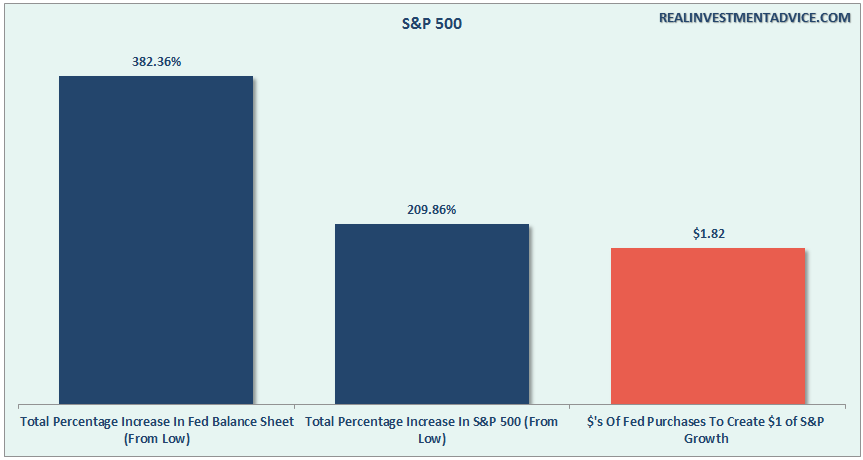
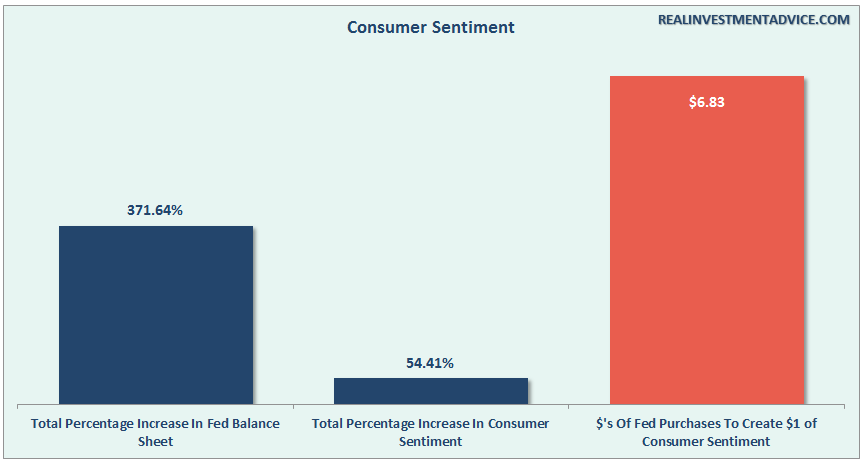
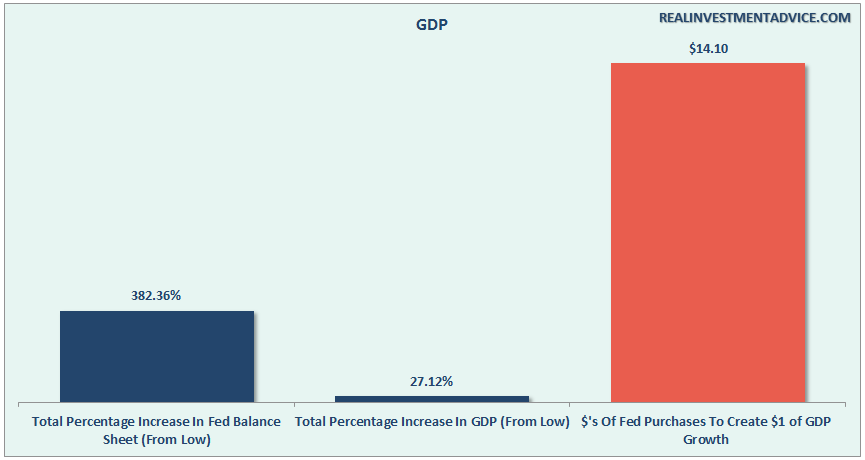
The charts below, show the effectiveness of QE on various parts of the economy. For comparison purposes, I have compared the total increase of the Fed’s balance sheet from 2009 to present to the percentage increase in each sector of the economy. I then derived from this analysis the total dollars of QE required to generate $1 of growth.
For example, it required $1.82 of QE for each $1 of increase in the S&P 500.
So, with this formula, we can take a look at the “effective cost” of QE on various parts of the economy.
It required $6.83 to boost consumer sentiment.
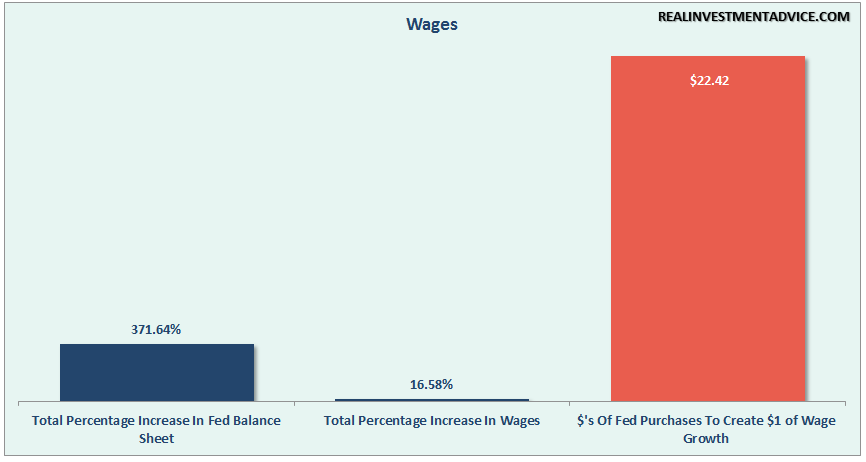
$22.42 for a very small increase in nominal hourly wages.
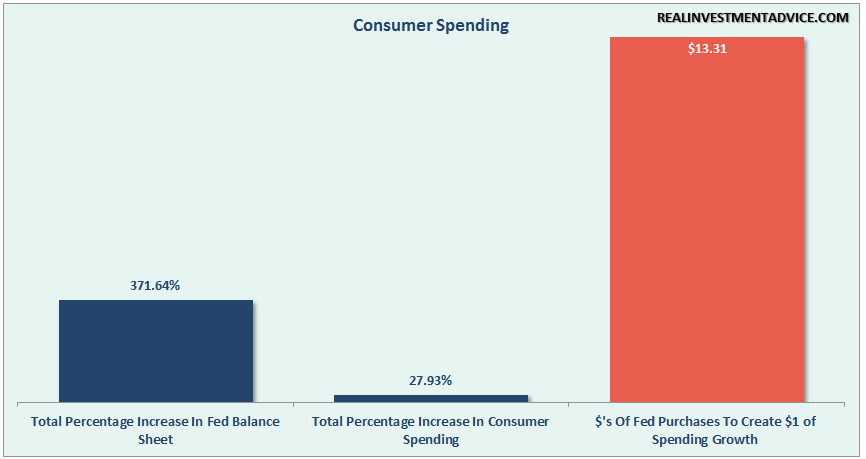
Consumer spending, the backbone of economic growth has increased by a total of 27.93% since 2009 at a cost of $13.31 of QE for every $1 increase in spending.
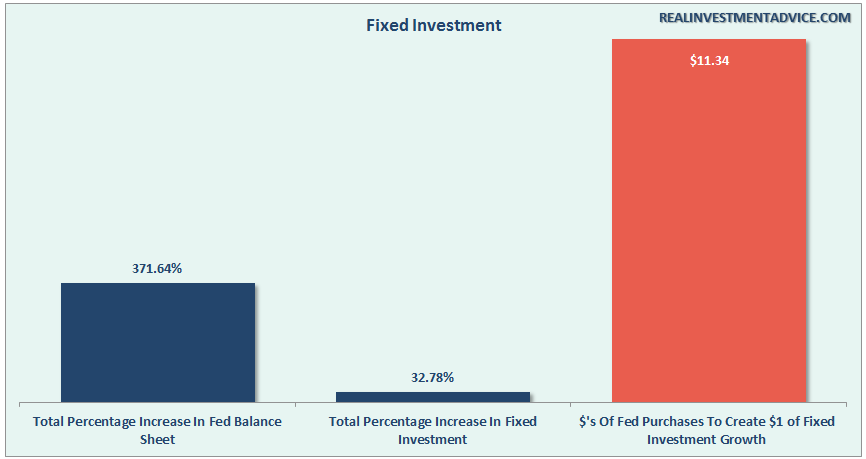
While companies are converting liquidity, high asset prices, and low interest rates to increase debt for M&A, stock buybacks, and dividends, little has translated into actual fixed investment. At $11.34 of QE to generate $1 of fixed investment, the transmission system is clearly weak.
The same goes for corporate profitability. $11.26 of QE for each $1 of corporate profits. It is actually substantially worse than that when compared to top line revenues which strips out share buybacks, accounting gimmicks, and other balance sheet chicanery.

While President Obama touts “the longest streak of employment growth since the 90’s,” it has come at the highest cost of growth of all at $47.16.
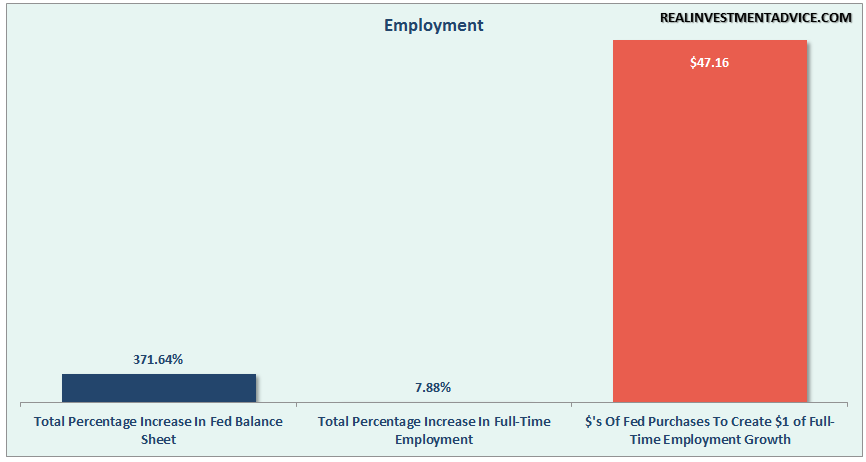
In fact, QE was actually much more cost effective at rolling individuals off of the employment rolls and shrinking the labor force by increasing those counted as “Not In Labor Force.” NILF has grown twice as fast and at half the cost of employment at just $22.83.

Of course, since each of these individual components are part of the broader economic landscape, how much QE did it require to boost overall economic growth? Just $14.10 of QE for each $1 of economic growth. What a deal?
The Fed’s hope has always been that at some point they would be able to wean the economy off of life support and it would operate under its own strength. This would allow the Fed to raise interest rates back to more normalized levels and provide a policy tool to offset the next recession.
It has taken a massive amount of interventions by Central Banks to keep economies afloat globally over the last seven years and there is little evidence suggesting growth is accelerating. In fact, there may be more evidence suggesting quite the opposite.
The problem for the Fed is the diminishing effects of QE as the forward pull of consumption is finite. In other words, there are only so many autos, houses, etc., which can be purchased within a given cycle. While another $2-4 Trillion in QE might indeed be successful in further inflating the third bubble in asset prices since the turn of the century, there is a finite ability to continue to pull forward future consumption to stimulate economic activity.
Furthermore, were we to have a recession within the next two-years, a very likely outcome, it is very unlikely the Fed will have the effect the paper describes. The more likely outcome is the effectiveness of rate reductions and QE will be substantially diminished and the subsequent destruction to the “wealth effect” will be far larger than currently imagined. There is a limit to just how many bonds the Federal Reserve can buy and a deep recession will likely find the Fed powerless to offset much of the negative effects.
The potential for a Fed policy mistake at this juncture is extremely high and climbing and the current “faith in the Fed” is likely misplaced.
The VIX Addendum
Over the last couple of weeks both Michael Lebowitz, CFA and I have been discussing the extremely low levels of the volatility index and the positions we have added to client portfolios as a hedge against a sudden reversion. (See here and here)
Michael did some additional work this past week into the VIX’s current situation.
The complacency in the equity markets, as measured by implied volatility (VIX), is at levels rarely seen. On its own this is not breaking news, but it is very strange when contrasted with the palpable concerns over the coming election and more general market risks such as weak economic growth, extreme valuations, corporate earnings recession and various geopolitical worries. We ended the previous article asking investors to consider employing equity insurance which looks cheap in the context of the risky environment.
The VIX is an equity volatility index that uses put and call option pricing to calculate an implied level of future volatility. Upon researching specific VIX insurance strategies, we noticed something that caught our attention and further strengthens the case for adding VIX exposure.

All futures and commodities exchanges release data on the contract volumes and positioning. As one can see in the graph above, net speculative positions in the VIX futures contracts are at record levels of short exposure. In other words, speculators betting on a VIX decline outnumber those betting on an increase in volatility by the largest margin in at least twelve years. A normalization of this positioning could quickly occur and in a disorderly fashion due to the extreme positioning of speculative traders. If this were to occur it would likely add to downside pressure on equity prices.
The current low level of implied volatility may be justified, and the political and economic environment that concern us may turn out to be benign. However, given the potential for market damaging events, the historically low price of insurance, the limited downside of the VIX and the massive net short VIX positions we simply ask one question: What is the harm in acquiring some cheap insurance to protect against downside risk?
“Got Vix?”
Another Warning Sign
As stated above, I have been pointing out signs as of late that only tend to appear during late stage economic expansions and generally precede the onset of a recession.
While there are many hopes of an end to the current “profits” recession, there is mounting evidence those hopes may once again be disappointed. One of the latest such indications is rising employee compensation.
While rising employee compensation is good from the view it should lead to rising consumption, it also reduces corporate profitability (wages reduce profits.) Furthermore, this is especially problematic currently as rising compensation is being offset by soaring healthcare costs due to the Affordable Care Act.
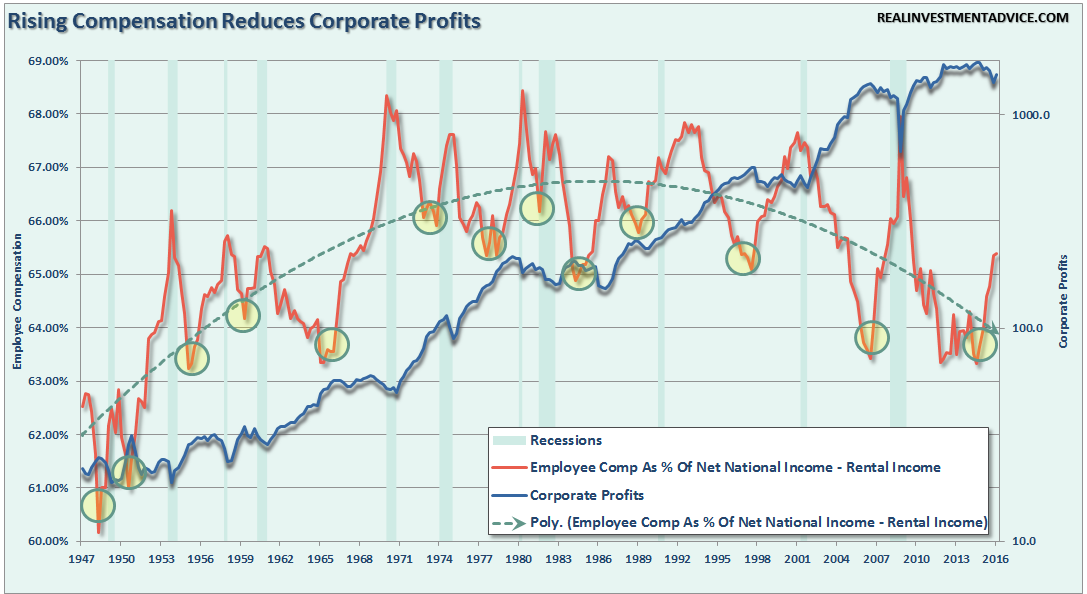
Like jobless claims, which hit historically low levels prior to recessions (see here), rising employee compensation has also denoted turns in economic growth and has preceded the onset of recessionary economic drags.
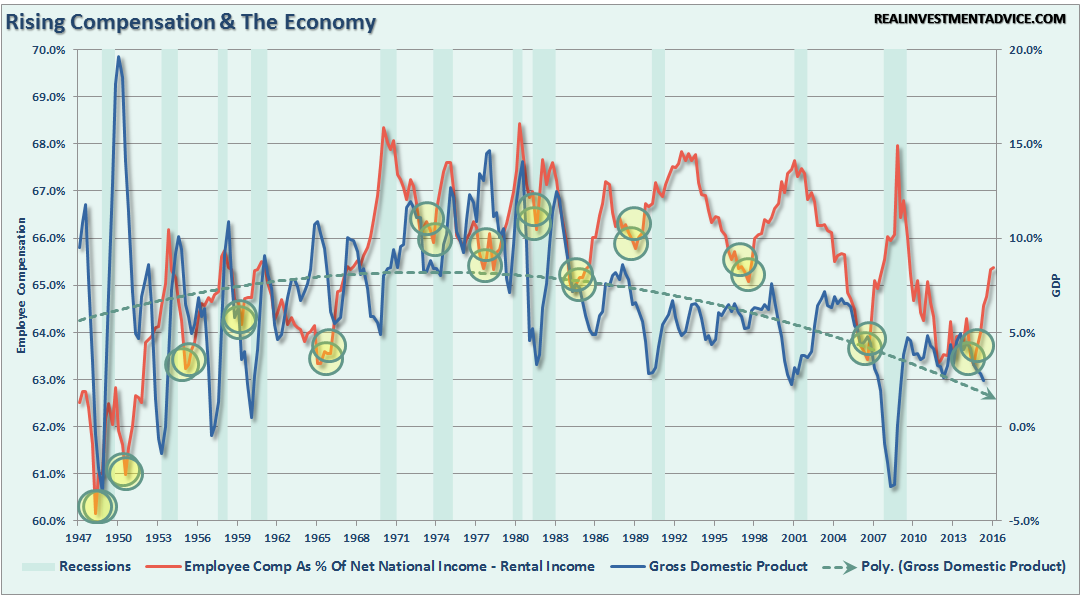
It is worth noting that in both charts above, despite hopes of continued economic expansion, both employee compensation, and economic growth have continued to trend to lower since the 1980’s. This declining growth trend has been compensated for by soaring levels of debt to sustain the current standard of living.
Of course, the question to ask is what happens when the “debt well” runs dry.