

Courtesy of Dana Lyons
The stock of Facebook has been in a rising wedge pattern for most of its lifetime – and the pattern is nearing a resolution.

Today’s Chart Of The Day takes a rare detour into single stock territory. As we do not trade individual equities for our clients, it is typically not a focus of ours. But with Facebook (FB) in the news today (along with a dearth of exciting charts) we take a look at a chart pattern relevant to FB throughout most of its history – and in particular, right now.
A “rising wedge” pattern involves a series of higher highs and higher lows on a price chart – with the lows demonstrating a steeper ascent. Given the sharper rise in the lows, the trendline connecting the highs and the trendline connecting the lows will necessarily intersect at some point, which we call the “apex”. That is where one can expect resolution to the pattern, if the wedge has not already been broken. Despite the higher highs and lows, the pattern is generally considered to be a bearish one. That is, prices more often than not resolve, or break out of, the wedge to the downside.
In the case of Facebook, one can consider nearly its entire history as one big rising wedge. After its IPO in 2012, FB began its launch higher in earnest in June 2013. Since that point, it has demonstrated a long-term series of higher highs and higher lows. However, the lows have been rising faster than the highs, resulting in the rising wedge seen on its chart here.
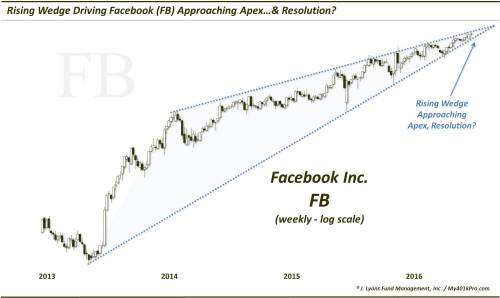
If this interpretation is correct, the apex is fast approaching. The upper and lower bounds of the wedge will intersect before the end of the year, with the exact time dependent upon where one draws the lines. We drew them on a weekly chart and the intersection should come by the end of November. That means we should have resolution of this wedge by that time. Absent a breakout before then, the range in FB trade should continue to squeeze tighter and tighter.
Should FB break the wedge to the downside, significant support (at this time) may lie just north of 100, then just south of 90. Those areas are not targets, but speculative support levels and subject to change based on the action in FB prior to a breakdown. A breakout above the top of the wedge obviously opens up considerable upside, with no resistance at all-time highs. Additionally, if one is to monitor this development, be on guard for a false breakout that eventually fails. That is, a breakout above the top bound, followed by an eventual reversal below the bottom bound. See this post for an example of a failed rising wedge breakout.
There’s no doubt that Facebook – the “F” in F.A.N.G. – has been one of the more steady and reliable stock climbers in recent years. As it is approaching the apex of its rising wedge, one can expect more volatility from FB once it finally breaks out of the wedge, whichever direction it breaks.
* * *
More from Dana Lyons, JLFMI and My401kPro.