

Here’s Why Technical Analysis Gets a Bad Rap
 Courtesy of Michael Batnick, The Irrelevant Investor
There are a lot of people who don’t believe in the merits of technical analysis. It doesn’t make sense to them that you can look at past price movements and determine future price movements. If stock prices are driven by earnings, how can a chart provide any insight? Well, yeah, stocks are driven by earnings in the long-run, but in the short-run they’re driven by sentiment, which can be observed by measuring supply and demand.
Anecdotally, nonsensical forecasts seems to permeate from technical analysis way more than fundamental analysis, which is the main reason it often gets ridiculed. (By the way, I’m not suggesting nonsensical forecasts aren’t ever driven by fundamental analysis, Dow 36,000 is a great example.) These outrageous claims are provided by technicians that abuse the charts. They’ll draw a few dozen lines, waves and retracements, and use a handful of oscillators. In addition to some of the crazy artwork, the patterns they’ll cite have names that sound ridiculous to the laymen; a rising wedge, head and shoulders, three peaks and a domed house, etc.
Here’s a recent “Red Alert” example from HSBC:
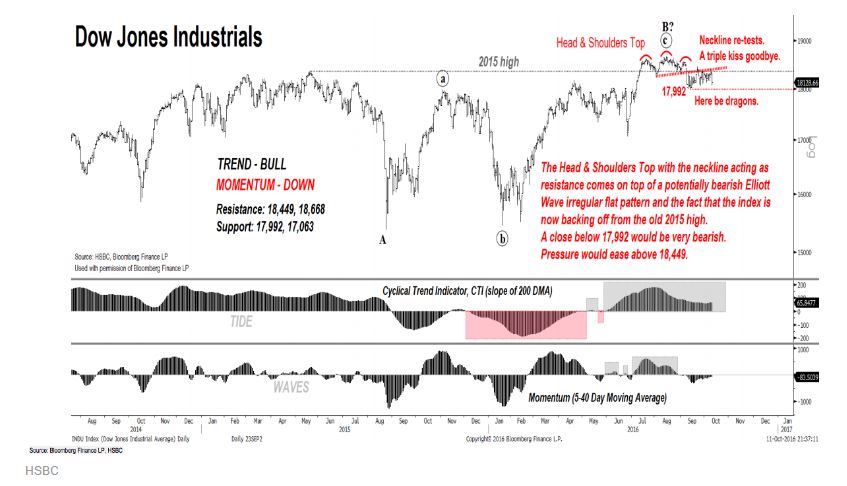
The Head & Shoulders Top with the neckline acting as resistance comes on top of a potentially bearish Elliot Wave irregular flat pattern and the fact that the index is now backing off from the old 2015 highs. A close below 17,992 would be very bearish. Pressure would ease above 18,449.
Lol, what?
Here is another example from an article yesterday in the Wall Street Journal with the headline “Technical Analysts are Getting Nervous About This Market.” It included the following statement:
Those who owned S&P 500 stocks only when both the index and its cumulative advance-decline line were below their 50-day moving averages, as is currently the case, would have lost about 50% since 2012, according to FBN Securities.
What does this actually mean!?!
And finally, stuff like this exists, which shows stocks vs. regional surface temperature of the Pacific Ocean…
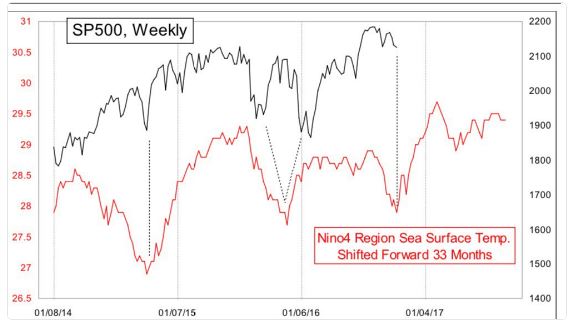
Requires no further commentary.
To me, technical analysis is not about predicting the future, but about managing risk. This distinction is really important and easily forgotten when we’re endlessly bombarded with the nonsense I’ve just shared.
Yes, the majority of technicians fail to beat the market, but one can just as easily look at the results from mutual fund managers and throw fundamental analysis into a waste basket. To be clear, I’m skeptical of somebody’s ability to look at a chart and turn that analysis into market beating results. But I’m no less skeptical of somebody reading financial statements and turning their analysis into market beating results. The point I’m trying to make is that technical analysts get painted with too broad a brush and the maniacal, rotten apples give the sane ones a bad name.
Source:
Technical Analysts Are Getting Nervous About This Market
HSBC: RED ALERT- Get Ready for a Sever Fall In the Stock Market
***
p.s. I ran into this article several days ago: Qualcomm Stock Setting up for Major Dive. In it, Ken Goldberg argues that QCOM will fall 50%. ~ Ilene
It's happened before, and it's about to happen again. Yet, most investors fail to recognize the set up for a 50% or greater drop in shares of Qualcomm (QCOM). Here's the Tale of the Tape.
As you can see from the monthly bar chart below, the pattern of price behavior leading into the all-time high in 2000 is repeating, at least in echo form, if not in duplicate form. Back then, Qcom shares ran up in parabolic (vertical) fashion to the red oval's reversal near $80, fell to around $40, then rose in a corrective yellow box into $65, putting in a pink box (lower high) reversal. Fast forward to the 2014 time frame to see shares rising into the red oval's reversal near $80, fall to around $40, and has risen in a corrective yellow box into $70, putting in a pink box (lower high) reversal.
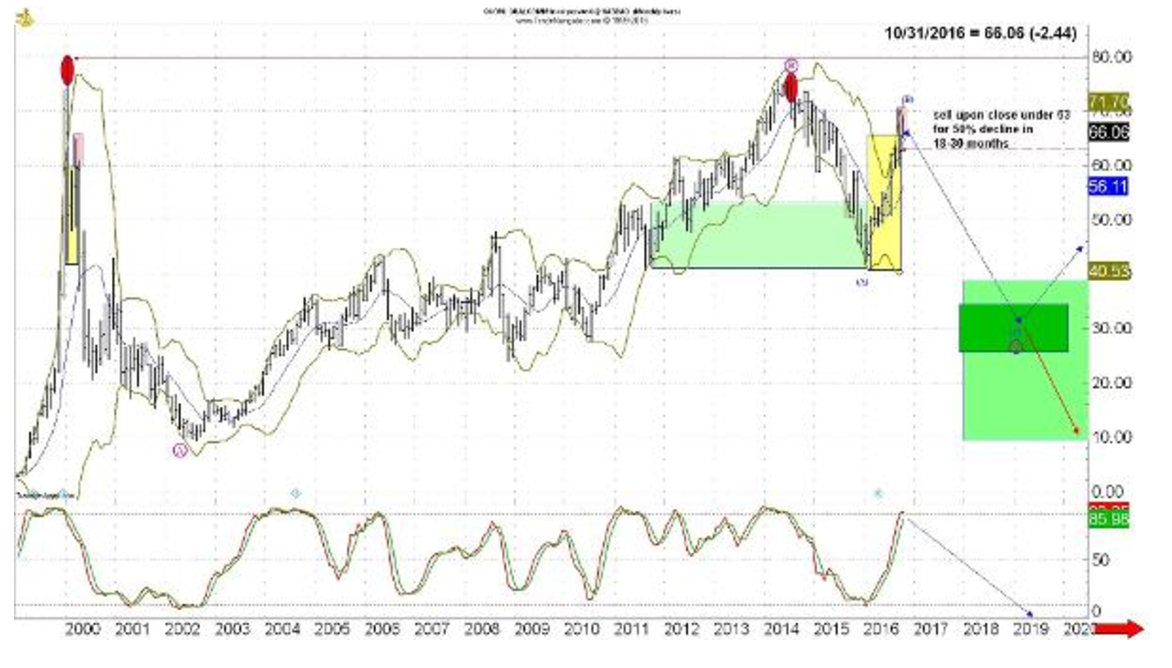
Read the full article here >
Ilene: When someone argues that a stock will fall 50% or more, I'd expect some mention of the fundamentals of the company. But Goldberg doesn't discuss QCOM's business, its products, its financial strength, its sales, its earnings, or its projected growth rate. Goldberg predicts an imminent price breakdown because QCOM fell when the dot.com bubble burst in 2000, because just like then, QCOM is hitting highs now — 14 years and 16 years later. Because QCOM fell then, it will fall now. End of story.
Imagine having applied that reasoning to AMZN:
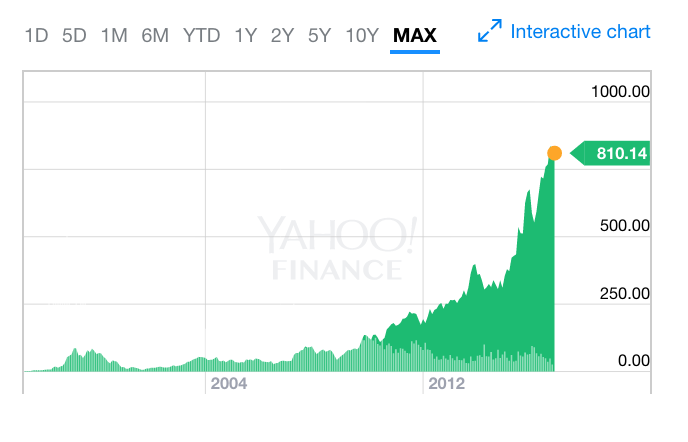
(Chart via Yahoo)
It gets better:
Historically, the crash low should be tested, if not marginally broken, but that is not required. Our decision support engine (DSE) will signal followers of its objective analysis and forecasting prowess when the risks of decline are not so skewed against holding these shares. But, that is at least months or quarters from now. Until then, the DSE warns that buying actions are not indicated here. Actually, selling actions are…
Short QCOM based on the analysis of our "Decision Support Engine." What is that?
If you're having trouble not sending me an email about how wrong the DSE is on this one, look back to past analyses that are done using this same protocol and see that most, certainly not all, have delivered positive outcomes, regardless of what the news of the day was and what TV pundits were "certain" of. Those are subjective inputs into an arena that is rigged to operate in an objective hallucination. The DSE, however, is designed to quiet the noise of the crowd's emotional interpretation of subjective data and shine the light on objective parameters…
"Subjective inputs" rigged to operate in an "objective hallucination?" Seriously.
Are you convinced?