

Courtesy of Lance Roberts, Real Investment Advice
Visualizing 10-Reasons For Caution
Just recently, David Rosenberg in a recent research note, laid out 10-reasons to be cautious in the market. I thought it would be useful to look at each of these in a visual form to get a better idea of what he is addressing.
The obvious reason to look at these indicators is that market records are records for a reason. As I wrote previously:
“First, “record levels” of anything are records for a reason. It is where the point where previous limits were reached. Therefore, when a ‘record level’ is reached, it is NOT THE BEGINNING, but rather an indication of the MATURITY of a cycle. While the media has focused on employment, record stock market levels, etc. as a sign of an ongoing economic recovery, history suggests caution. The 4-panel chart below suggests that current levels should be a sign of caution rather than exuberance.”
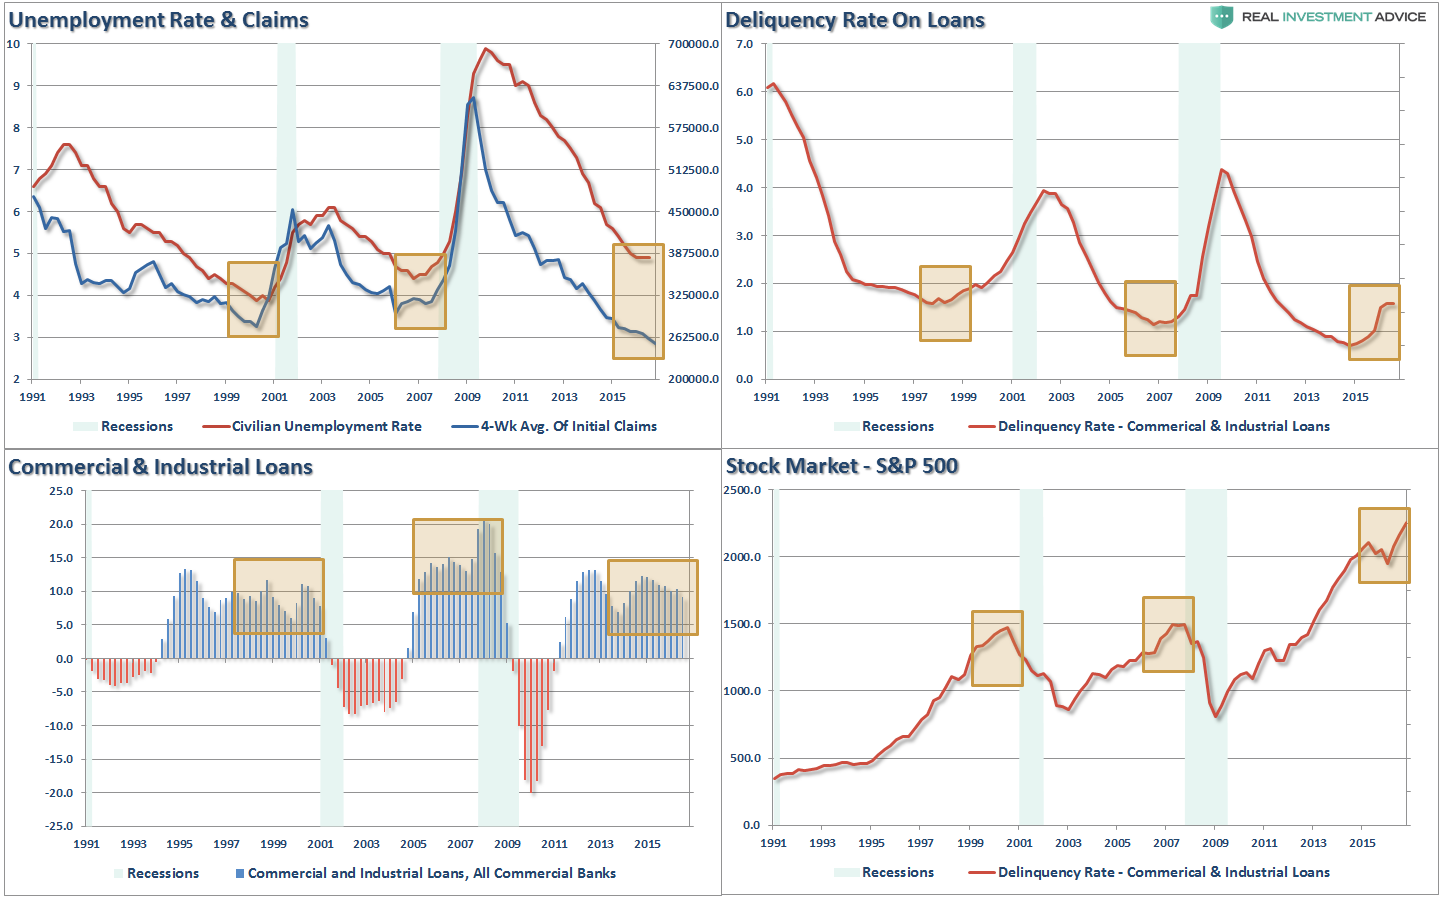
However, while economic data suggests we may be closer to the end of the current economic cycle than the beginning, data related specifically to the stock market is also suggesting the same.
Let’s take a look:
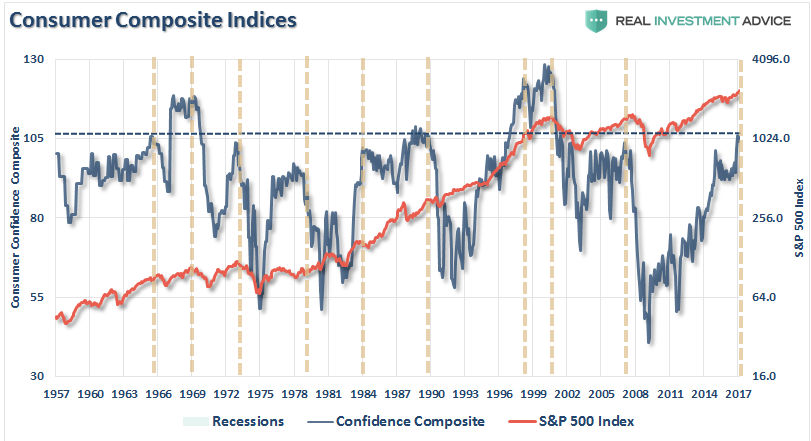
1 – Confidence Levels at 105
The chart below a COMPOSITE confidence index consisting of both the University of Michigan and Census Bureau indices. At 105, the index is currently at levels that have historically denoted the end of an economic cycle. (This should be expected as it is the point in the economic cycle where everything is now “as good as it gets.”)
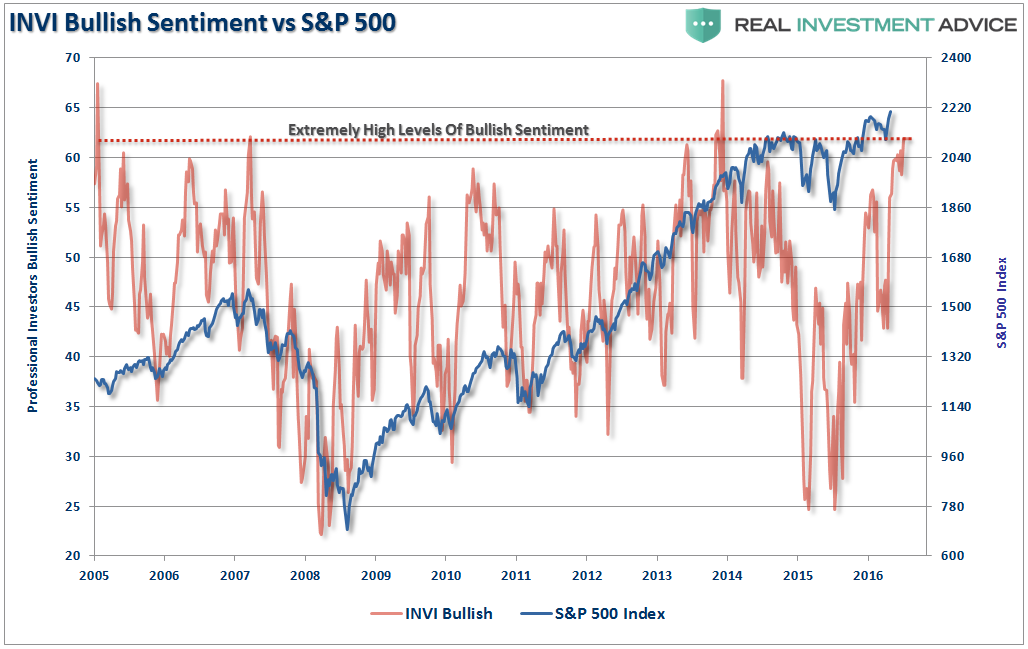
2 – Investor’s Intelligence Sentiment at 61.8%
The Investor’s Intelligence survey is a survey of professional newsletter writers and professional investors. It has a long record and has been widely adopted as a contrarian market indicator for good reason. At 61.8%, the index is currently at levels normally associated with market peaks both short and longer-term.
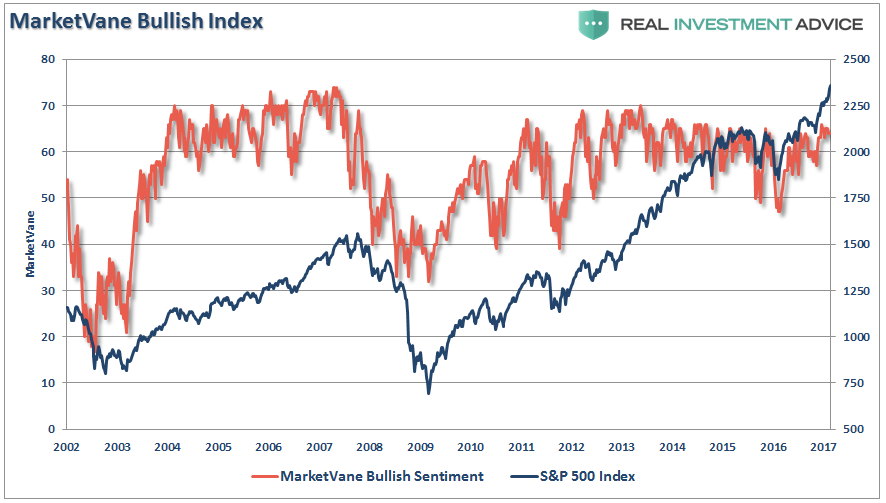
3 – Market Vane Bullish Sentiment: 64%
The Market Vane bullish sentiment index is a yardstick for traders as it measures the number of traders that are long a certain commodity. In this case the S&P 500 index. Currently, at 64%, as with the other indicators above, it is currently reflecting levels of bullishness that have historically been associated with corrective actions.
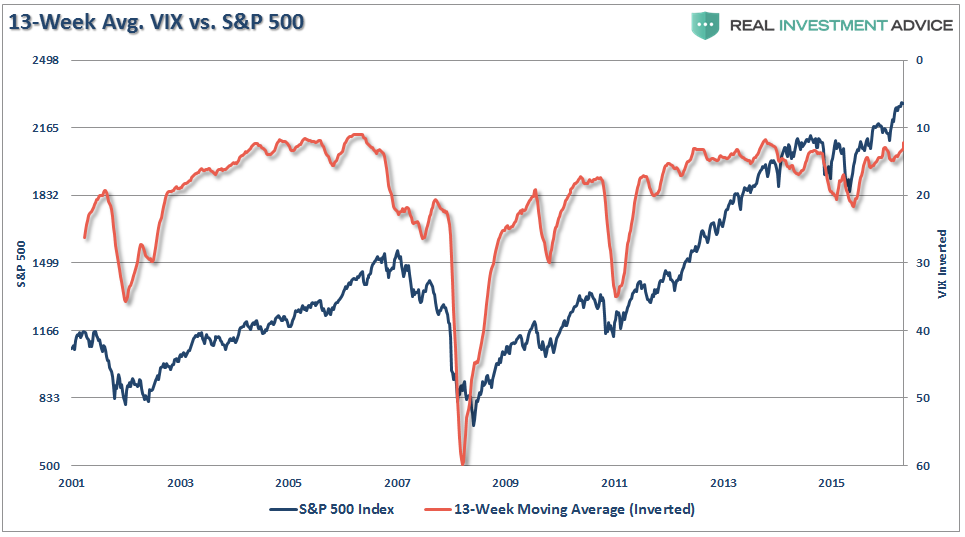
4 – CBOE’s equity volatility index (VIX) @ 12.2 — The S&P’s 65-day rolling volatility (inverted scale) is at levels which typically occur ahead of a corrective phase.
The volatility index shows the market’s expectation of 30-day volatility. It is constructed using the implied volatilities of a wide range of S&P 500 index options. This volatility is meant to be forward-looking, is calculated from both calls and puts, and is a widely used measure of market risk, often referred to as the “investor fear gauge.” When the gauge is at extremely low levels it suggests that investors have little fear of a market reversion. From a contrarian standpoint, this is when corrections have tended to occur.
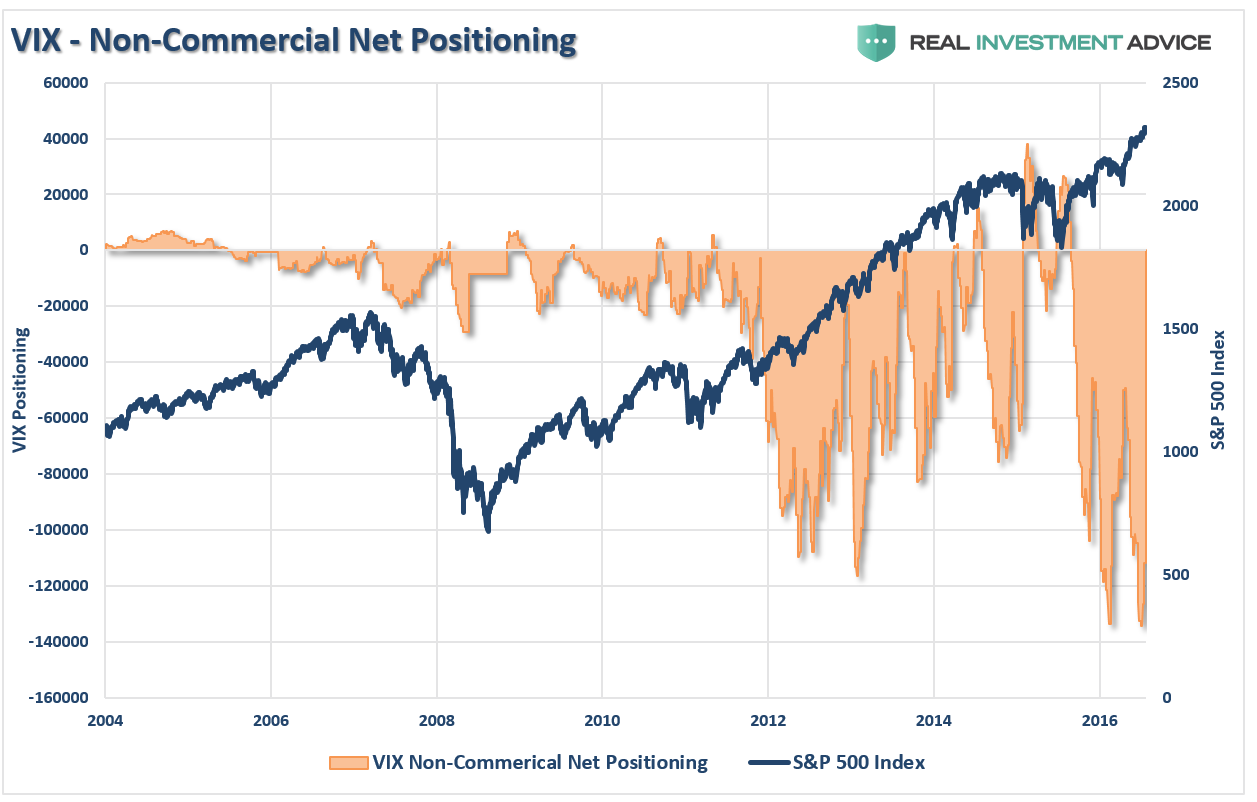
I noted last week the record levels of short positions currently outstanding on the Volatility Index.
“The extreme net-short positioning on the volatility index suggests there will be a rapid unwinding of positions given the right catalyst. As you will note, reversals of net-short VIX positioning has previously resulted in short to intermediate term declines.”
The chart below shows the 13-week moving average (65-day) of the volatility index versus the S&P 500. I have inverted the index to provide a clearer relationship between the two indices. From a contrarian viewpoint, the index currently suggests the risk of a correction outweighs the potential for a further advance.
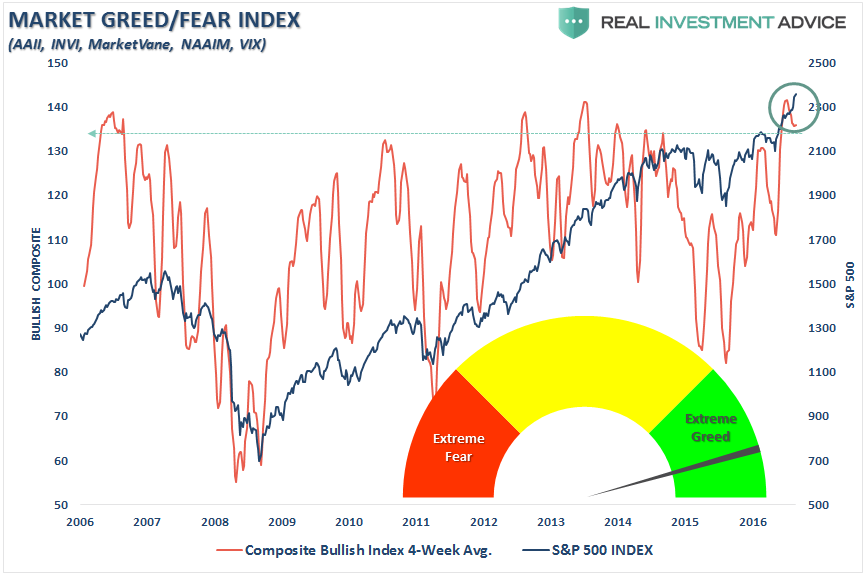
The next chart compiles all the indices above into a single composite for analysis purposes. Given the combined composite is pushing extreme levels, a bit more caution is likely well advised.
5 – Forward P/E multiples: 18.75x 2017 estimates, 16.75x 2018 estimates and 24x trailing CAPE. All are above long-term means and forward estimates are subject to large downward revisions.
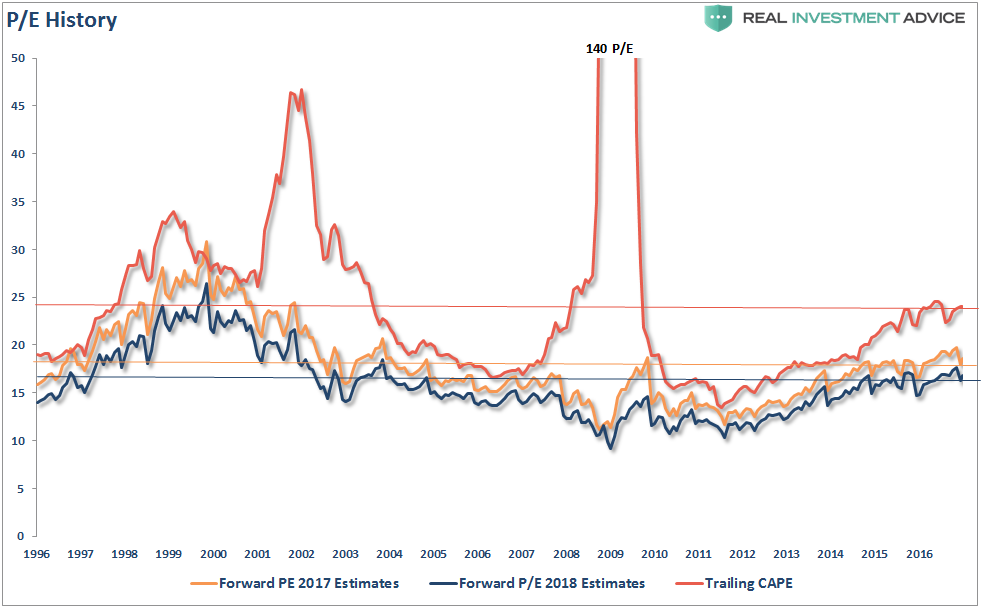
Of course, as I showed in my article earlier this week on valuations:
“Over any 30-year period the beginning valuation levels, the price your pay for your investments has a spectacular impact on future returns. I have highlighted return levels at 7-12x earnings and 18-22x earnings. We will use the average of 10x and 20x earnings for our savings analysis.”

“As you will notice, 30-year forward returns are significantly higher on average when investing at 10x earnings as opposed to 20x earnings or where we are currently near 25x.
The point to be made here is simple and was precisely summed up by Warren Buffett:
‘Price is what you pay. Value is what you get.’”
6 – NYSE Put/Call Ratio: 0.80x
One way to interpret the put-call ratio is to say that a higher ratio means it’s time to sell and a lower ratio means it’s time to buy. When the ratio is above 1.00 it suggests the market is out of balance to the sell side and equity exposure can be increased. When the ratio is below 1.00 it suggests the market is out of balance to the buy side and investors should be more cautious.

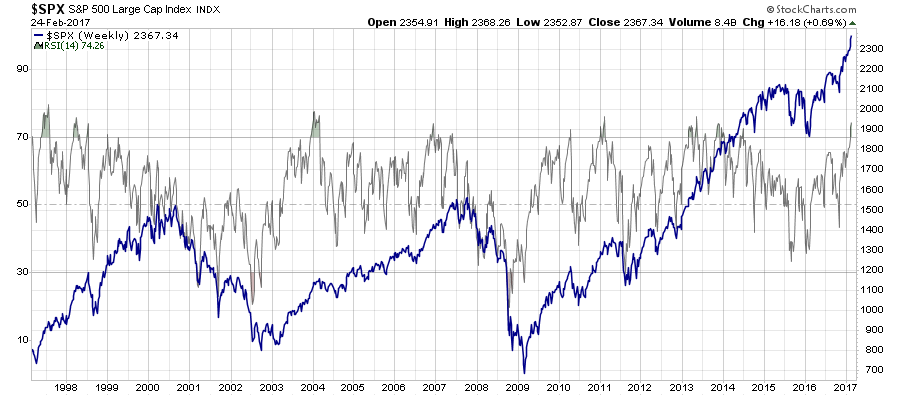
7 – The 14-week RSI (Relative Strength Index) has moved to 74.26, above the 70 level widely viewed as being an “overbought” threshold.
As shown, on a weekly basis there are only a few points where the markets have been this overbought on a weekly basis. With the exception of the 2013-2014, during the $85-billion per month QE program, each previous occasion has triggered a short-term correction or worse.
8 – The S&P 500 has now gapped up nearly 8% above its 200-day moving average, another sign of an overextended stock market.
As I have explained numerous times in the past, moving averages are like “gravity.” Prices can only move so far above the longer-term average before the gravitational force exerted causes prices to “revert to the mean.”

The problem, is these cyclical bull markets are quickly believed to be the beginning of the next secular multi-decade bull market. However, as discussed previously, this is currently unlikely the case given the lack of economic dynamics required to foster such a secular period.
The chart below brings this idea of reversion into a bit clearer focus. I have overlaid the 3-year average annual real return of the S&P 500 against the inflation-adjusted price index itself.
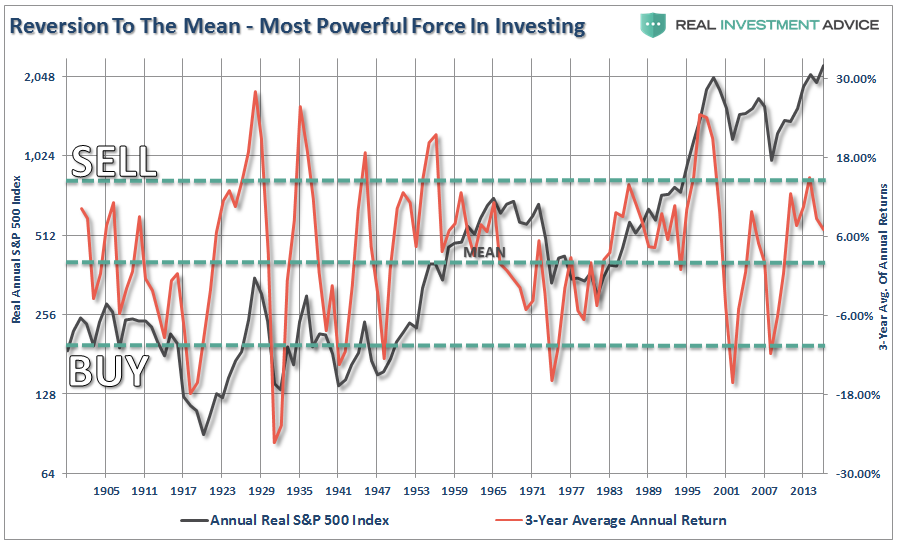
Historically, we find that when price extensions have exceeded a 12% deviation from the 3-year average return of the index, the majority of the market cycle had been completed. While this analysis does NOT mean the market is set to crash, it does suggest that a reversion in returns is likely. Unfortunately, the historical reversion in returns has often coincided at some juncture with a rather sharp decline in prices.
9 – Earnings expectations have significantly lagged market price action — in fact, according to S&P Capital IQ data, analyst EPS projections for 2017 have actually dipped a little to $130.31 from $131.02 three months ago.
As ZeroHedge recently noted from Goldman Sachs:
“Cognitive dissonance exists in the US stock market. S&P 500 is up 10% since the election despite negative EPS revisions from sell-side analysts (see Exhibit 1). Investors, S&P 500 management teams, and sell-side analysts do not agree on the most likely path forward. On the one hand, investors, corporate managers, and macroeconomic survey data suggest an increase in optimism about future economic growth. In contrast, sell-side analysts have cut consensus 2017E adjusted EPS forecasts by 1% since the election and “hard” macroeconomic data show only modest improvement.”

10 – The S&P 500 has already climbed above year-end targets for well over half of the Wall Street strategists out there.
As I laid out at the beginning of this year in “The Problem With Forecasts”, even the most bullish analysts weren’t as optimistic as the market is now.
“Since optimism is what sells products, it is not surprising, as we head into 2017, to see Wall Street’s average expectation ratcheted up another 4.7% this year. Of course, comparing your portfolio to the market is a major mistake, to begin with.”

The problem is that since there is never an expectation the markets can go down, it is just that event belief that eventually ensures an investor error.
This point was clearly made this past week as I was asked to pen an article for Millennials about saving and “passive indexing.”
I did a very thorough study showing that even dollar cost averaging from current valuation levels is likely to be disappointing over the next few years. See:
“So, with this understanding let me return once again to the young, Millennial saver, who is going to endeavor at saving their annual tax refund of $3000. The chart below shows $3000 invested annually into the S&P 500 inflation-adjusted, total return index at 10% compounded annually and both 10x and 20x valuation starting levels. I have also shown $3000 saved annually in a mattress.”
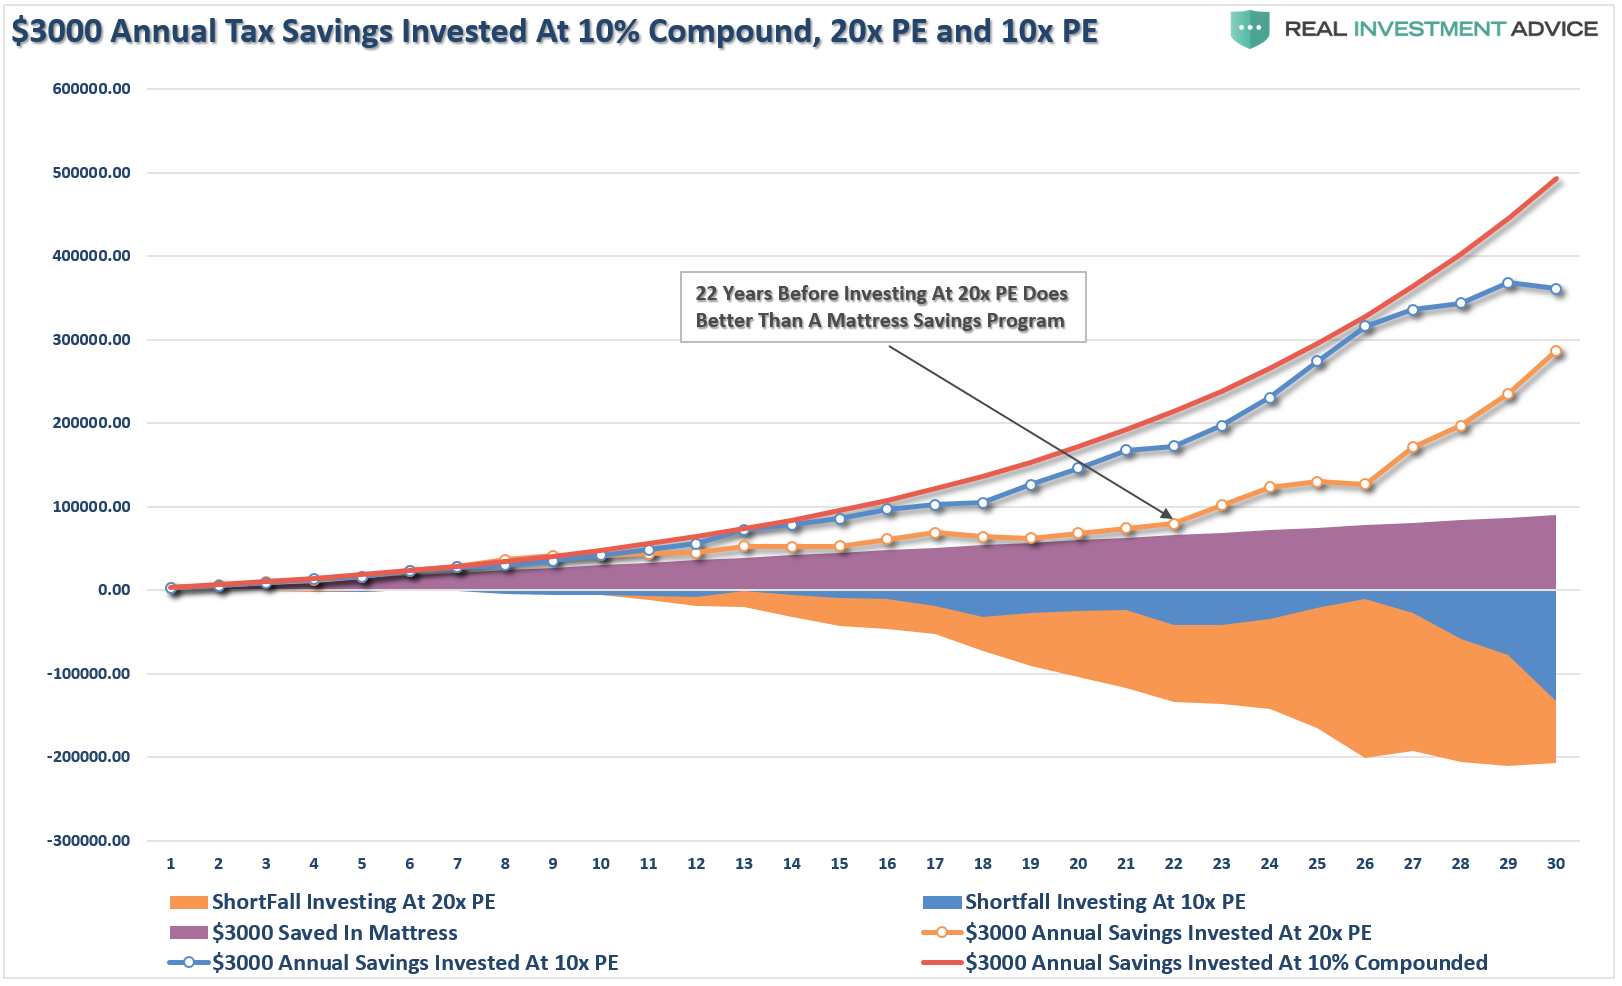
“I want you to take note of the point made that when investing your money when markets are above 20x earnings, it was 22-years before it grew more than money stuffed in a mattress.”
When I returned the study and my findings back to the media outlet, I immediately received a message back stating:
“This not a message that we want to project.”
In other words, they wanted an article suggesting that Millennials should just “buy everything.”
Maybe that is an indicator within itself.