

Courtesy of Lance Roberts of Real Investment Advice
Bull Market Still Intact…For Now
This past Wednesday, on the Real Investment Hour, I spoke with Greg Morris about the technical backdrop of the market. During that interview, he discussed that from a technical perspective the bullish trend of the market is still in place, and despite fundamental underpinnings being stretched, investors should remain allocated to the market.
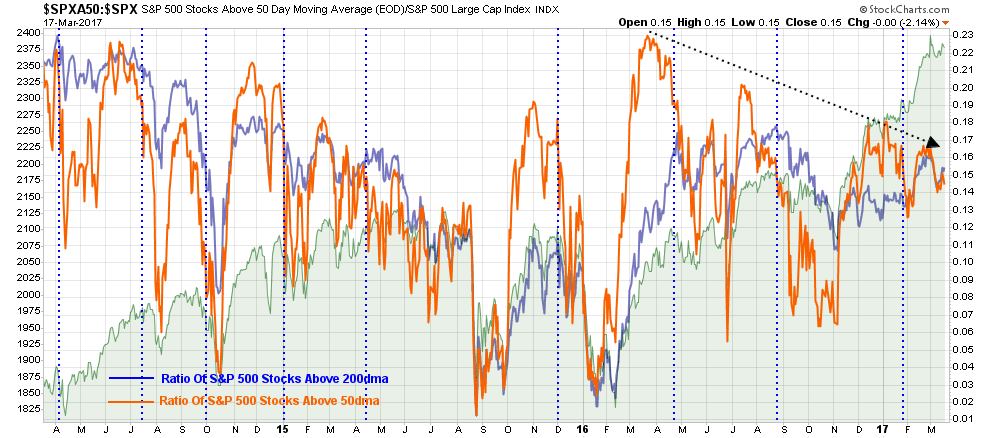
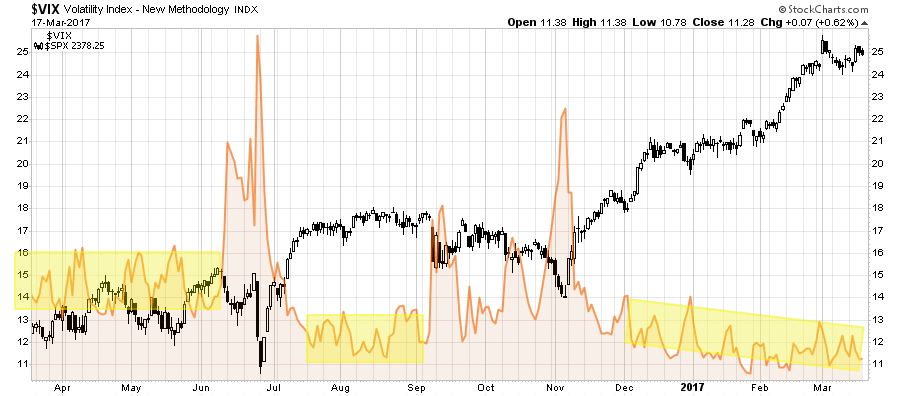
This is shown in the chart below.
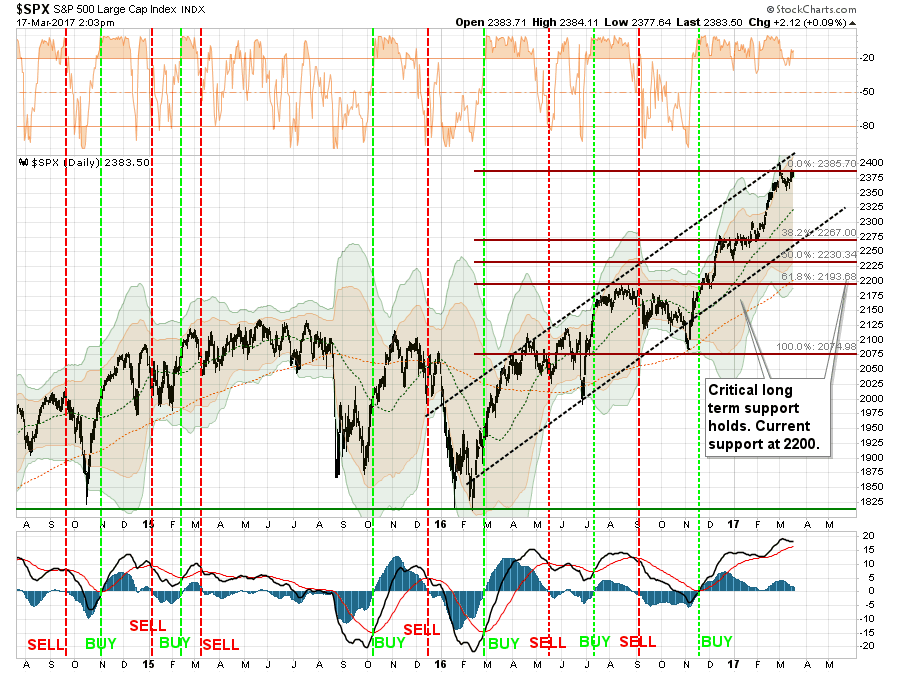
For now, portfolios remain allocated to the market currently. However, as I stated two weeks ago, we did lift profits and rebalance current holdings. Furthermore, we are not adding any “new” positions currently until some of the extreme overbought conditions are resolved.
This is what the “technicals” dictate, at least for now.
As noted in the chart above, the market is very close to a short-term “sell signal,” lower part of the chart, from a very high level. Sell signals instigated from high levels tend to lead to more substantive corrective actions over the short-term. I have denoted the potential Fibonacci retracement levels which suggest a pullback levels of 2267, 2230, and 2193. To put this into “percent terms,” such corrections would equate to a decline of -4.7%, -6.2% or -7.8% from Friday’s close.
To garner a 10% decline, stocks would currently have to fall 237.8 points on the S&P 500 to 2140.20. Given there is little technical support at that level, the market would likely seek the next most viable support levels at the pre-election lows of 2075 or a decline of -12.7%. Such a decline, of course, would not only wipe out the entirety of the “Trump Bump,” but would also “feel” much worse than it actually is given the exceedingly long period of an extremely low volatility environment.
Speaking of low volatility, the market has now gone 108-trading days without a drop of 1% for both the Dow and the S&P 500. This is the longest stretch since September of 1993 for the Dow and December of 1995 for the S&P 500.
This is a pretty impressive feat given the rise in policy uncertainty since the election, geopolitical tensions on the rise, and economic data remaining weak.
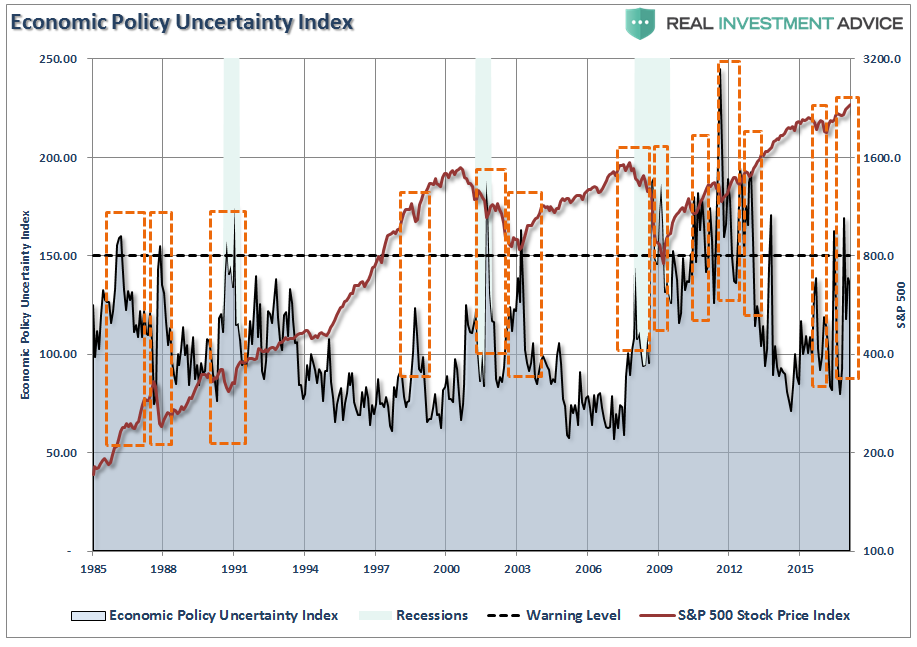
In other words, there is a whole lot more downside risk than upside potential in the current environment.
This is particularly the case following the FOMC’s decision on Wednesday to hike rates further.
An Unlikely Outcome
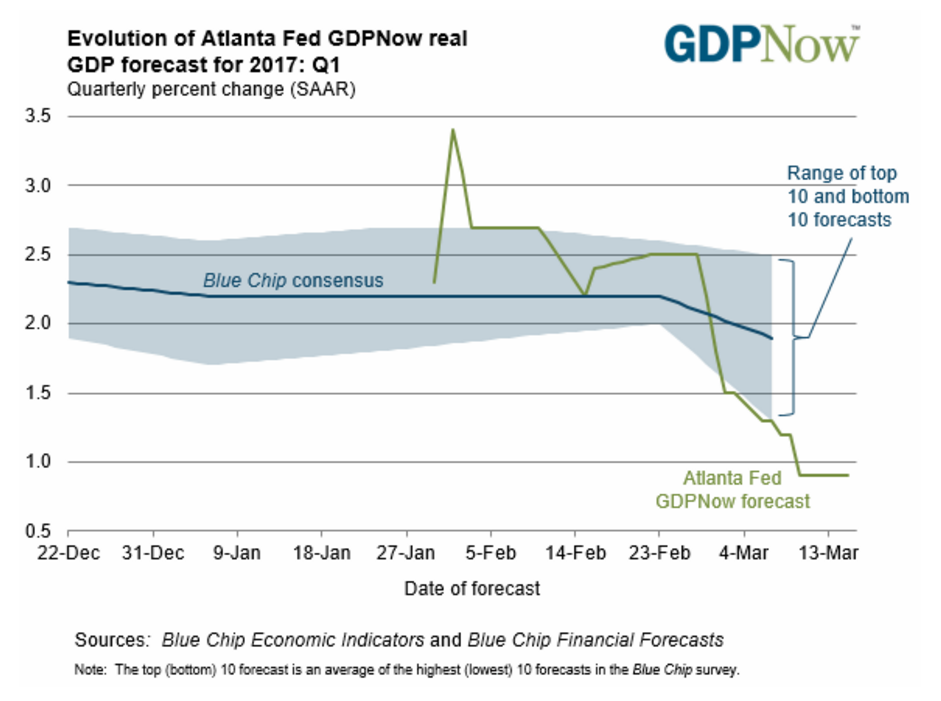
On Wednesday, as the Fed hiked rates for the second time in the last three months, and a third time since December of 2015, the Atlanta Federal Reserve released their latest GDP NowCast which reduced estimates for first quarter growth to just 0.9% from nearly 3% in January.
Interestingly, following the Fed’s announcement of a rate increase, stocks, bonds and gold all surged.
The reason I say “interestingly,” is that higher interest rates increase borrowing costs which slow economic growth and quells inflationary pressures. Therefore, since the primary argument to support the second highest valuation levels in history is an economic and earnings recovery story, higher rates slow both of those supports.
Of course, the wisdom of hiking interest rates, thereby removing monetary accommodation, at the lowest average level of economic growth on record is also questionable.
Furthermore, there is also some doubt as to the veracity of the following justification from Ms. Yellen regarding the policy change:
“The simple message is the economy is doing well. We have confidence in the robustness of the economy and its resilience to shocks.” – Janet Yellen, March 15, 2017.
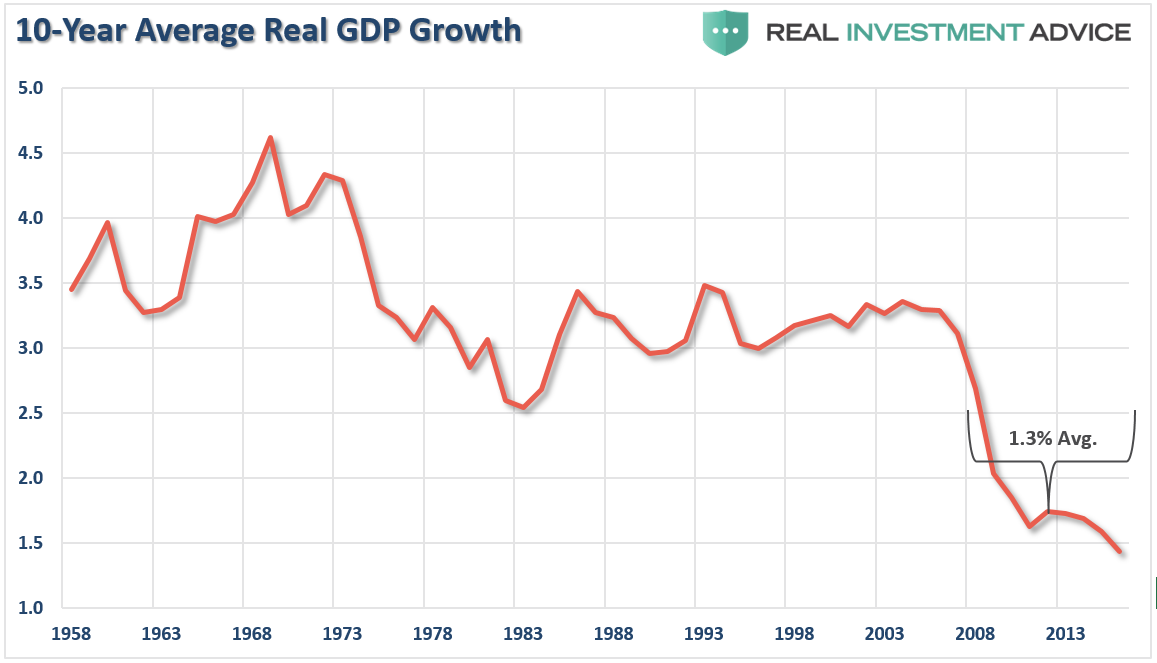
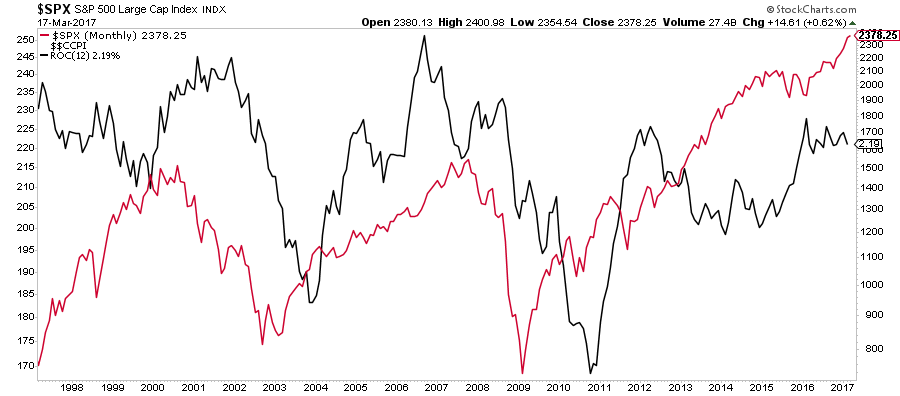
First, I guess we have to quantify what we mean by the “economy is doing well.” In 2016, the economy grew at 1.60% which is well below the expected average of 2.0%. But more importantly, take a look at the chart below of annual “real” economic growth rates.
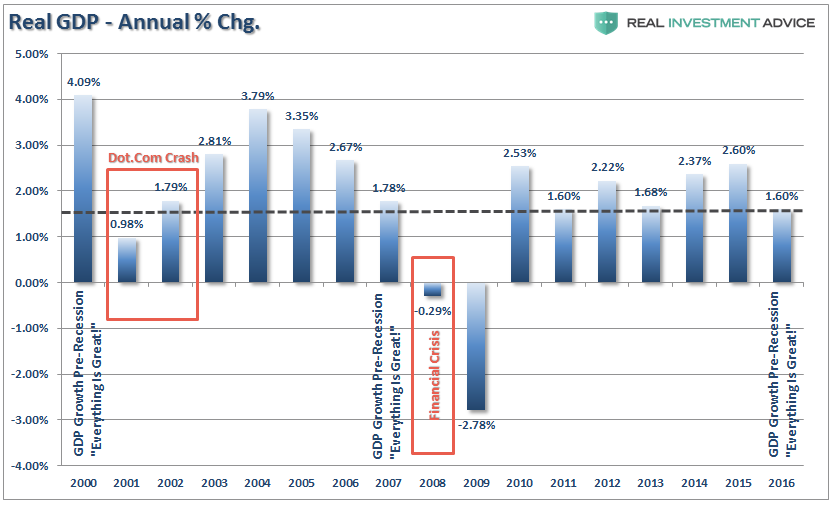
There are three things of importance to note:
- The economy did well prior to the last two crisis as well. In 2000, the annual growth rate was 4.09% and 1.78% in 2007. It was a “Goldilocks” economy.
- While there was a recession in 2001, the economy averaged a real return that year of 0.98%.
- The current “real economy” is currently growing, as of 2016, at a rate lower than that prior to the last two recessions and “crisis” in the market and only slightly above that of the recession based 2001 average.
At a 1.6% growth rate, there is very little wiggle room between Fed rate hikes and a negative growth rate in the economy. The chart below adds the Fed Funds (effective rate) to the chart above.
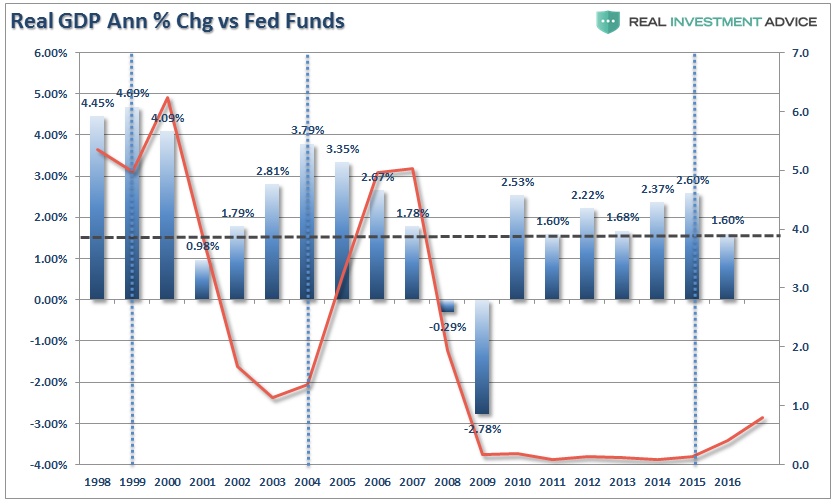
Two important points:
- As soon as the Fed has started hiking rates previously, economic growth began slowing.
- While it is often stated the economy remained buoyant following rate hikes, it was ONLY a function of the time for starting economic growth rates of 4.09% and 3.79% to fall below ZERO.
The table and chart below show the historical time frames for the economy to fall into recession following the start of a rate hiking campaign. At 1.6%, historically, the economy has found a “crisis” withing 1-3 quarters.
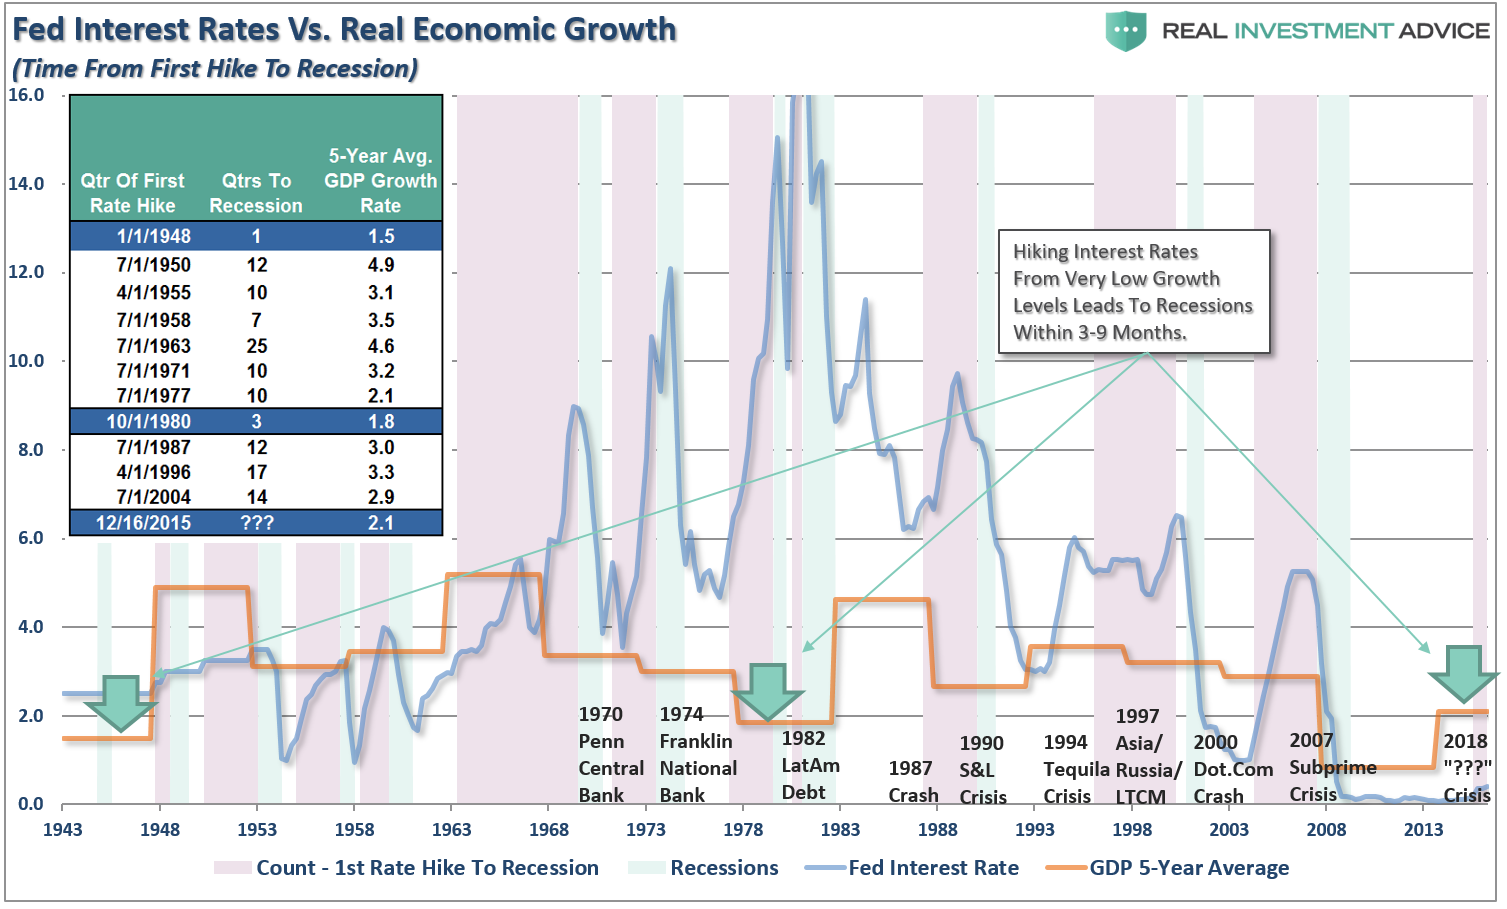
IMPORTANTLY: The number of times the Fed has started a rate hiking campaign and NOT pushed the economy into either a recession, crisis, or both equals ZERO.
So, as to Ms. Yellen’s second point of a resiliency to shocks, there is actually no historical evidence of that being the case. The only question is what “shock” eventually ignites the “gasoline” of excessive complacency, exuberance and leverage into a “panic fueled” explosion of liquidation.
Unfortunately, I do not know the answer to the “what” or the “when” of when such will occur. I am certain that it “will.”
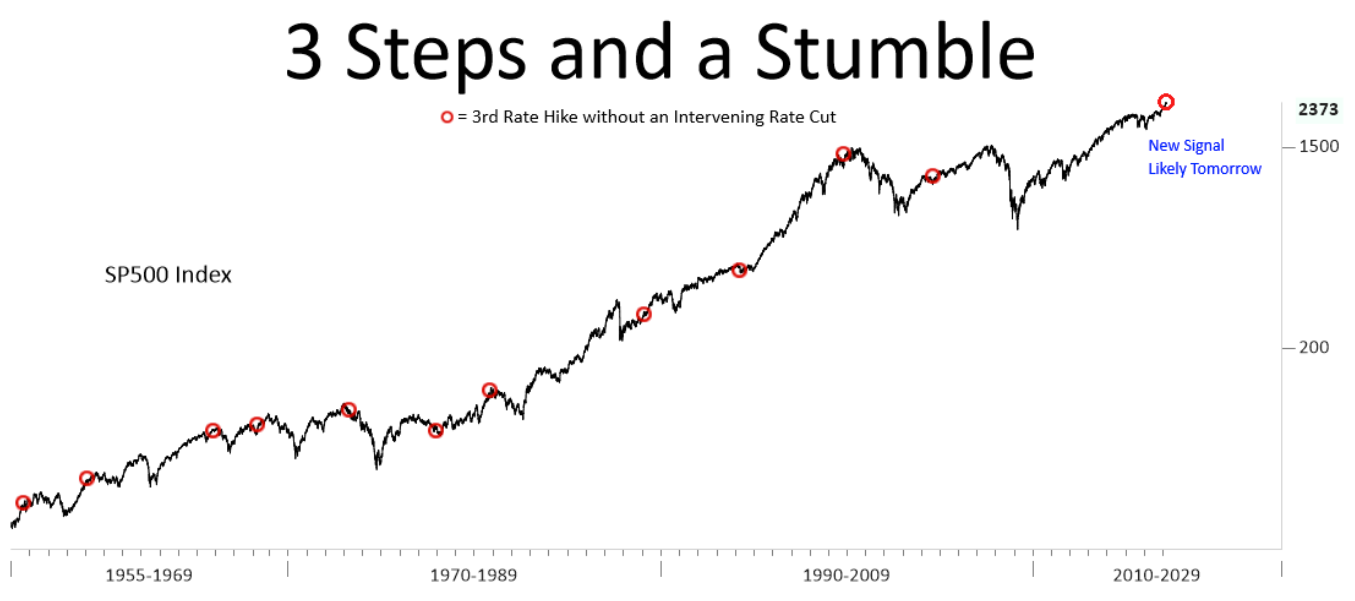
But, if you need more evidence, here is this tidbit from Nautilus Research’s Tom Leveroni:
“Many are familiar with the Wall Street adage ‘3 Steps and a Stumble,’ popularized by Marty Zweig, for the tendency of stocks to sell off after the 3rd Fed rate hike in the cycle.
The S&P 500 has endured significantly below average results from 1 to 12 months after 3rd rate hikes in 11 events back to 1955. Six (more than half) of those hikes occurred within a year of a major cyclical top for stocks (1955, 1965, 1968, 1973, 1980, 1999).
The only exception was in 2004, when stocks rallied for another three years before the Great Recession.
Hikes are generally bad for stocks, somewhat bad for the US dollar, and bullish for 10-year yields and commodities. Will rate hikes derail stocks this time around? In a general sense, yes. Is there a deterministic formula or trigger for precisely when? Probably not.”
Warning Signs
So…let’s add this all up.
The bullish trend is intact which keeps portfolios on the long-side of the ledger for now. However, such does not mean one should become complacent and ignore the rising number of warning signs.
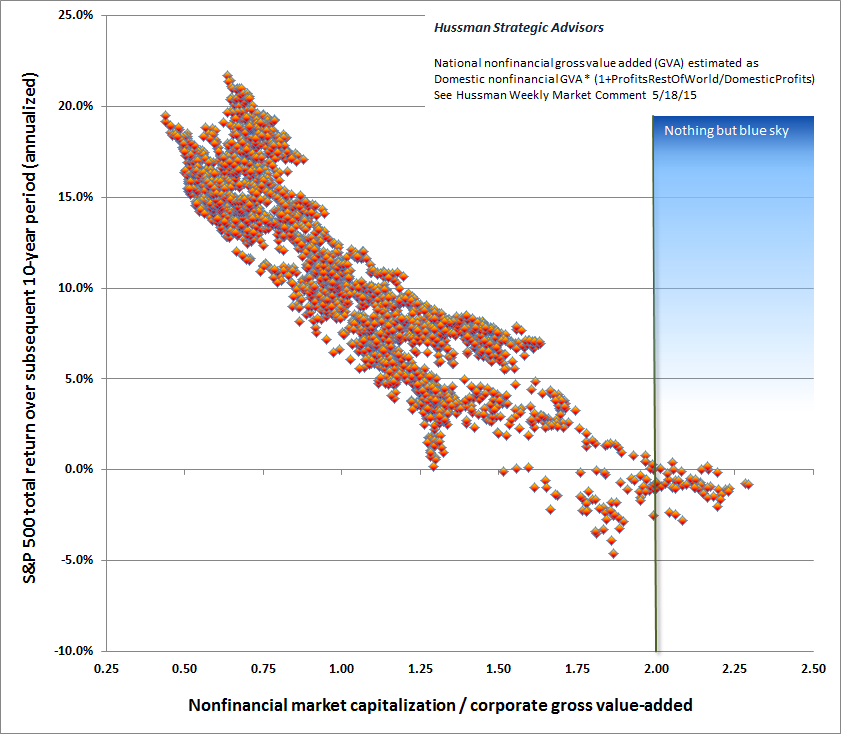
Valuations are stretched by most measures. While valuations are not reliable “timing” indicators, they are useful in predicting forward rates of returns.
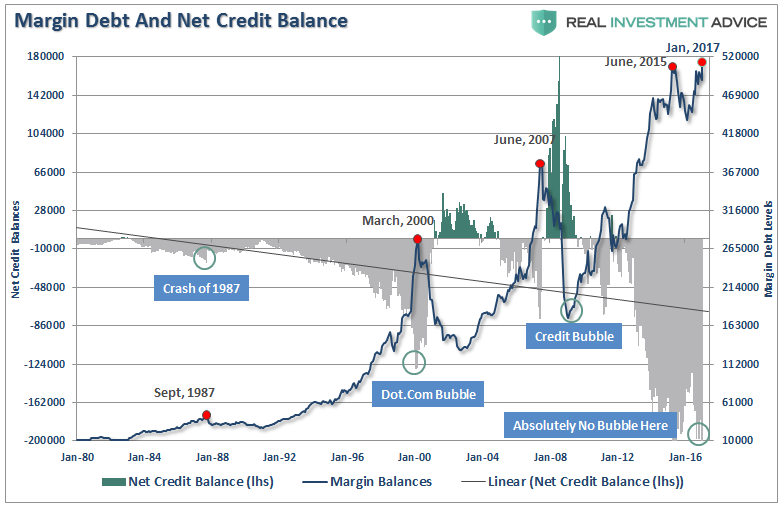
Leverage is extended. Margin debt, or the dollar volume of stocks bought with borrowed money, surged just before the US election to a record high.
Retail investors are suddenly rushing to buy. Following eight years of net outflows, they poured nearly $80 billion into mutual funds and exchange-traded funds in the post-election rally. This year, however, corporate insiders have been selling at the fastest pace in nearly 30 years.
The technicals are showing vulnerability. From Monday through Thursday last week, the number of stocks making 52-week lows surpassed new highs. It was the longest streak since November 4 and was a sign of a toppy market, Rosenberg said. Also, the S&P 500 has traded as much as 10% above its 200-day moving average.
Investors are complacent, and it seems like the calm before the storm. The Chicago Board Options Exchange volatility index, or VIX, remains unusually low. The S&P 500 has not swung 1% intraday for almost 60 days, the longest streak in at least 35 years.
The Fed is raising rates. The rise in short-term yields could invert the yield curve before the Fed Funds rate is at 3%. An inverted curve — which reflects investors’ expectations for slower future growth — is seen as a precursor of recession.
Inflation is picking up. The core personal consumption expenditures index is at a 30-month high. Though it is likely not sustainable, it is a “classic late-game signpost.”
The gap between economic growth and sentiment is large. The pace of policy change in Washington could disappoint investors.

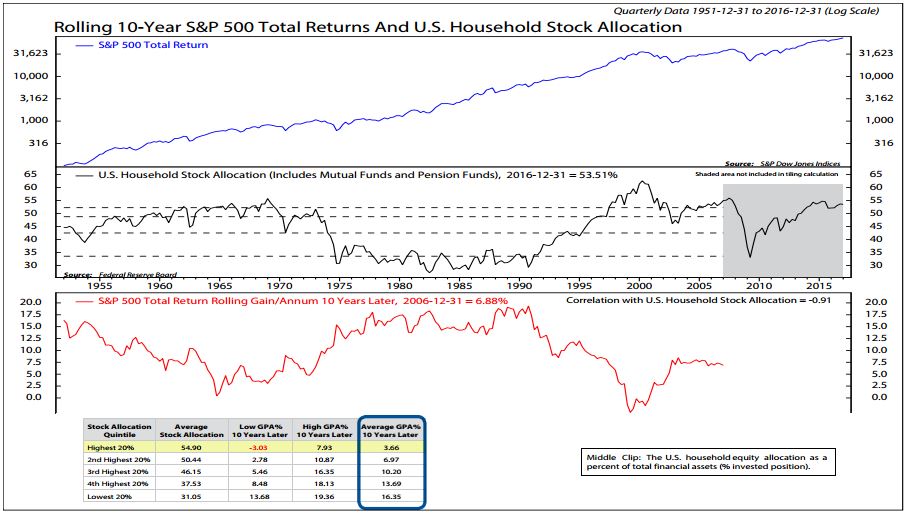
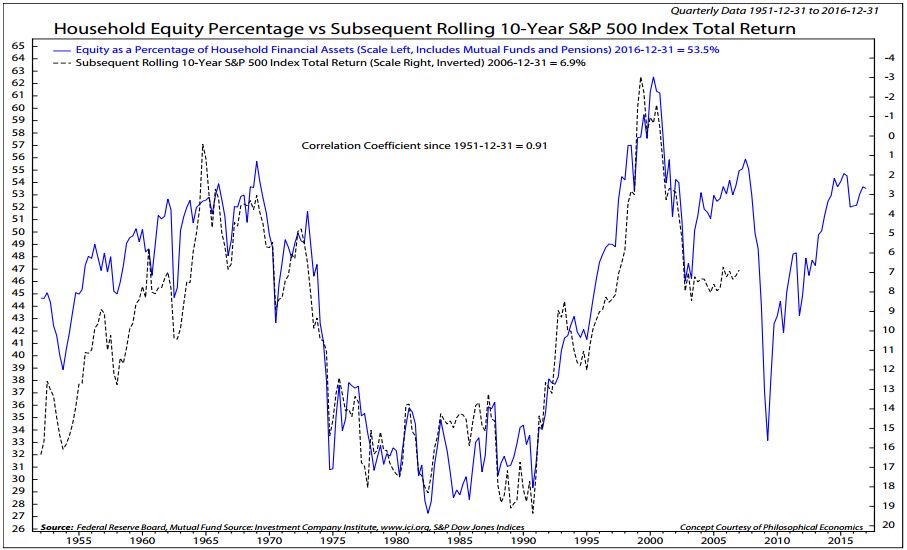
Households have over-ownership. Their exposure to the stock market is 42% above the norm.
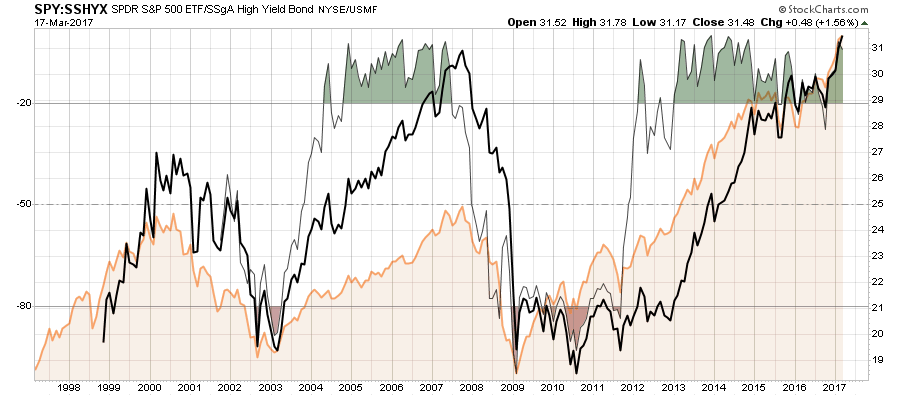
Credit markets are frothy. The compensation investors demand for choosing risky US high-yield bonds over risk-free assets — the risk premium — is widening.
Like gasoline, all of these warnings are “inert” and, other than smelling really bad, are harmless.
Well, that is until your cousin “Randy” shows up and decides to have a quick smoke.