I'm trying to read the market tea leaves and get a sense of direction.
While I think the markets are still in great shape and on their way to 15,000 I have also noticed that many of you do operate on a much shorter time horizon than I do so we need to clarify our positions before we get into the new year.
I may be bullish but I'm 80% cash right now and waiting for a buying opportunity. Like October, when we let a lot of good ones get away from us, I'd rather chase a breakout late (and we did recover well) than have my positions cut down because I overstayed my welcome.
The first thing we need to do to look at the markets is to let go of our conventional view of time, because your stocks really don't know what day it is and they really don't care when you bought them. I know that seems obvious but the whole concept of the "Santa Clause" rally just goes to show you how even the big boys still like to believe!
I'm using Bigcharts.com for this so you'll have to open each one to see what I mean:
The Dow is up 2,000 points from it's previous channel at 10,500 that it stayed very tight in since rising to that level in early '04.
It is easy to see how most people feel this is a logical top since the prior move was also 2,000 points.
Prior that 28 month consolidation at 10,500, it had bottomed out at 8,500 (and I'm a statistician, not a chartist so I throw out aberrant data points) in the aftermath of 9/11 when it fell from that same 10,500 median. Taking an extra step back, to a 10 year view, we can see we actually were in a consolidation along the 10,500 line since the market topped out in 1999. We know 9/11 was an unusual event so we can toss those data points too, making a very tight range.
But a tight range from what?
So it is easy to see how the markets haven't actually done anythng in over 7 years and finally they take off (ironically (or NOT) on 9/11) and gain 20% and we are so amazed we simply can't believe it can continue! Yet if we take another step back, to a time I call "The Clinton Years" we can see that the market went pretty much straight up from 3,000 in early 1993, to 11,000 in 1999. There was one major correction of almost 2,000 points in 1998 (Asian meltdown), triggering a normal Fibonacci Retracement of 1/3 off the 6,000 point run.
If, in the macro picture, we are truly in the early stage of a major advance, then we would expect any pullback here not to violate 11,500, a 50% retracement of our recent gain. I know, ouch! That does sound like a lot, but it is good and natural if it happens. I'm more worried that it won't happen and things will get away from us very quickly. Certainly the 30 Dow components are making more than 20% more than they did in 1999 (do we even have to look?). Surely they must have gained some real value in the past 7 years…
We may have a consolidation but I will consider that to be an excellent opportunity to snap up some long-term positions for as long as it lasts but be prepared for it to last a while, just in case!
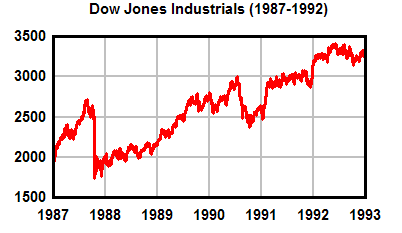
Going back to the long chart, the Dow had a run from 1,000, in 1983 to 2,500 in mid-1987, back to 2,000 (33%) in 1988 where it took the year off before jumping another 1,000 in the next 18 months, giving up 1/2 of that gain in late 1990 which led to another 1 year consolidation. In late 1992 the Dow got some traction, made it to 4,000, where it stayed for 1994 before going hyperbolic between 1995 and 1999.
So if we look at 1993 to 2000 as seven years of plenty, then 2000 to 2006 would represent our 7 lean years. In fact, this 20% 12 month spike, has not even mitigated the 20% 18 month drop we experienced after 9/11.
My logic is that we are nearing the end of our consolidation at a median of 10,500 and are preparing to join the Hang Seng and the Nikkei at much higher levels.
But, like I said, market analysts don't believe me. They believe that 8,500 was a good and proper number for the Dow in 2003, that the entirety of the move from 8,000 in 1998 to over 11,000 later that year had been some sort of mistake. Most of the older traders believe that because they had been shorting the hell out of the Dow in 1998 as it had already run up 100% in 3 years and that was a nice round number to call a stop. It gave them great pleasure, 4 years later, to say "see, 11,000 was too high."
And the older traders still control the markets – the move from 8,500 to 10,500 was 23.5%. A 23.5% move from 10,000 (the low end of the channel) brings us to 12,350 – right where we are! The top of the range is 12,967 so that will be our break-out target but we need to be mindful the big picture retracement of 11,500 if we stray below 12,350.
The summary, bullish but cautious! I hate the Dow, it's a stupid indicator but it's the one we all use so I use it too, rather than going over S&P numbers or NYSE nuimbers but, the truth is, they do all tend to track together so we cannot deny the power of this index (or at least the people who track it).
But please, please, please – let's try to keep it in perspective!


