
Not a very nice way to start a new year! With all the selling that went on this week, a review of the Big Picuture GOAX (BPG) bias is in order to see what’s up with this market now and find out if the currently active 9/13/07 BPG bearish bias should be maintained or dumped and replaced.
Recapitulation of Current and Prior S.O.M.A. and BPG/EOD Bias Updates.
Going back to August ’06, the BPG bias was upgraded to bullish and stayed bullish all the way to 9/13/08 when it was downgraded to bearish taking effect one month later on 10/13/08. The review of the general market conditions called for the downtrend to resume at the latest 3 weeks after the FOMC meeting no matter what the FOMC would do regarding the interest rates.
And Mr. Bernanke surprised us with a 50 points cut but the subsequent impact to the market sure didn’t surprise us as per this excerpt from the 9/13 S.O.M.A.:
« On the other hand, if Uncle Ben cuts the Fed rate by 50 bps, then this will probably trigger a big reaction rally but the impact of such a move should send the dollar crashing and oil and gold shooting creating an inflation spiral which will eventually impact the market and stop the party. »
Sounds familiar?
The COMP chart below is a technical analysis (TA) which was part of the 9/13/07 S.O.M.A. and illustrated the various pattenrs going back to 2005. It also showed, as I usually do on a BPG bias change, the best odds projected path for this bear market which I believed to have started on EOD 7/19/07 which even today nobody seems to want to acknowledge despite the writing on the wall. The initial best odds target was set at 2200. The chart also makes reference (red circled numbers) to the various end of day (EOD) GOAX bias (short-term timeframe – 1 month) and the BPG (mid and long-term – 2 to 6 months) bias changes going back to May ‘06. A brief description of the referenced bias changes is attached on Appendix A.
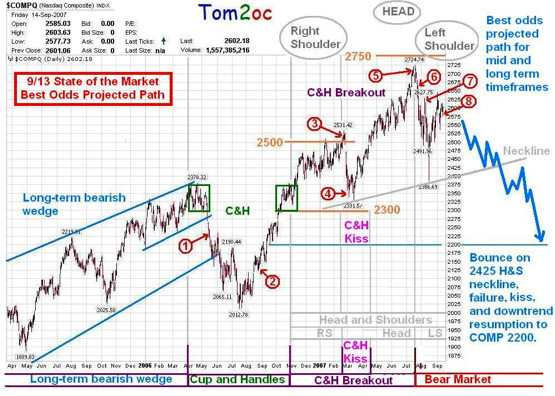
The chart showed a potential head and shoulder pattern in play at the time with the left shoulder in formation. The 9/13 S.O.M.A. was written one week ahead of the FOMC meeing on intent. I didn’t want to be influenced by what Uncle Ben would do and after finalizing it, the conclusion was that the market would resume going down no matter what the cook had served us . The week following the publishing of the chart on the blog, the FOMC cut 50 bps and this triggered a big market rally which ended up to be entirely negated as per the S.O.M.A conclusion. In fact the only impact the FOMC rally had on the market technical analysis (TA) was to simply morph a potential bearish H&S pattern into another as bearish and as dreadful one : A potential bearish rising expanding pattern.
On 9/13/07, the day of the BPG market downgrade to bearish, COMP closed at 2601. To reach the neckline at 2400, COMP needed to drop 7.7% and to reach the initial target of 2200, COMP needed to drop 15.4%. These were bold calls at the time but with COMP having closed at 2505 on 1/4/08 it now only needs to drop another 2.2% to test the same trend line (now 2450) and 12.2% to reach the initial target of 2200. Therefore despite the big FOMC rally, the 9/13 BPG bias continued to hold waters pretty good nonetheless.
Below is the updated COMP chart showing the new bearish pattern in play.
.png)
Is this currently active 9/13 BPG bias still valid or should it be dumped and replaced? Let’s review the GOAX partners and the usual BPG indicators to assess the general market conditions of this wild and crazy market.
Always good to know where we’re coming from so let’s reveiew the conclusions of the two most important S.O.M.A.s and BPG bias updates of 2007:
The 3/1/07 S.O.M.A. which concluded to no BPG bias change despite the DJI mini-crash and broad panic :
"Best odds (80%): This is just a kiss action to pullback to the 2300/2375 cup breakout range. I see this correction ending soon with best odds for max pain at 2300. Once the bottom is in, the market should resume trending strongly up and go back above 2500. I will continue to buy the dips unless COMP fails 2300. Once 2500 is crossed, odds are the market will shoot to 2750 and then 3000. This will probably be coming in 2008 and China will be most probably the trigger for a real financial crisis next time when the olympic boom is over end of 2008 or sometime in 2009. I feel the China scare of this week was just a small warning to give us a taste of the coming big one. There is still a lot of construction and growth to see in China until we get to the olympics.
And bounced above just above the max pain line of 2300 and quickly recovered 2500 as expected before resuming the uptrend after a volatile summer to go touch 2861.51 only 138.49 points below the 3000 target or not even 5% below it. Heck, COMP lost close to 100 yesterday, it could have touched 3,000 in a just a few more bullish days! LOL!
And here is the conclusion of the 9/13/07 S.O.M.A. where I called the party to be over and turned bearish :
« There you have it, I believe we are in a bear market which started at the last market high on 7/19 and which will last as long as Mr. Market wants it to last. This is based on patterns and on the GOAX system I’ve been using for months. »
And part of the reasons to turn bearish was the action in the Chinese stocks and my change of my opinion in relation to the timing of the bursting of the China bubble.
« 5. China’s parabolic run is unsustainable. Therefore, even if Uncle Ben triggers a big rally, this China situation will only get worse and this should, in the mid to long-term timeframes have a big negative impact on global markets. »
You will quickly notice that I’ll be talking a lot about the China situation in this 1/4/08 S.O.M.A. and BPG Bias Update.
China is a KEY factor for both the short-term and the mid to long-term horizons.
This BPG update will include the following technical analysis (TAs) and the levels to watch for:
|
AAPL |
200MA Stocks |
NAMO Nasdaq McClellan Oscillator |
|
GOOG |
HGX Housing |
GOLD |
|
BKX Financials |
SPX – SP-500 |
US Dollar |
|
VIX |
WTIC Crude oil |
SSEC/FXI China |
|
EEM Emerging Markets |
SOX Semis |
TLT Long-term Bonds |
|
IBB Biotechs |
|
|
Let’s review the GOAX partners and then the usual S.O.M.A. indicators to assess the general market conditions in respect of that great lesson learned by Mr. Livermore :
"But my greatest discovery was that a man must study general conditions, to size them up so as to be able to anticipate probabilities."
Jesse Livermore
The analysis below might be a tool for you to make your own mind about this market. There will be as many ways to conclude on the information below than there will be readers of this analysis. And this is the intent because nothing beats thinking for yourself and making your own mind. I could be totally wrong and in left field on the way I analyze the partners and I could be looking at the wrong indicators or missing key ones so do not trade or make decisions on anything you read below unless you want to lose money, and go bald.
Just Think for Yourself!
Let’s start with our old friend AAPL who had a pretty rough day today.
Hope you’ll enjoy the TAs!
Tom2
DISCLAIMER
Investing in the financial markets can involve considerable risk. Past performance is not necessarily an indication of future performance. The information included in this 1/4/08 State of the Market Analysis and Big Picture GOAX Bias Update is prepared for informational purposes only. It is not a solicitation, or an offer to buy or sell any security or use any particular system. Information is based on historical data and believed to be reliable, but there is no guarantee as to its accuracy. This is not personally tailored advice concerning the nature, potential, value or suitability of any particular security, virtual portfolio or securities, transaction, investment strategy or other matter. From time to time, the author of this report may hold positions in securities mentioned, but is under no obligation to hold long or short such positions. No offer from any part with respect to the sales or purchases of any securities or use of any particular system is intended or implied, and nothing contained herein is to be construed as a recommendation to buy or sell any securitiesAny prediction/forecast made on the direction of the stock market or on the direction of individual stocks may prove to be incorrect. . If you purchase/sell/short a stock/ETF/option mentioned on this report, you do so at your own risk. The author of this report will not be liable for any losses or damages, monetary or otherwise, that result from the content of this report.
RESTRICTIONS
This 1/4/08 State of the Market Analysis and Big Picture GOAX Bias Update is for non-commercial use. This report must not be distributed in any way or form to other individuals or reproduced in any form or for any use without the written permission from tom2oc@blogspot.com.