
Wow that's three rotten weeks in a row!
Paul Price made us feel a little better by showing us that our misery has plenty of company as even the value investors are getting crushed this year. Unfortunately one of the top losers is Eddia Lampert (down 28.95%), who, like me, holds a lot of Sears stock!
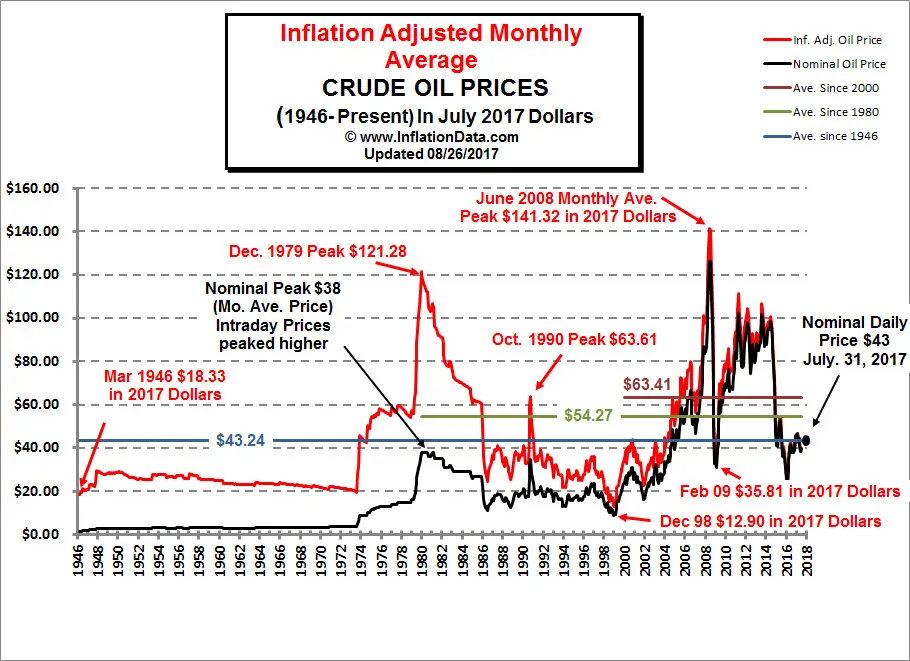
Back on June 13th, I mentioned in that Wrap-up that I expected 12,500 to hold if only oil would calm down. It didn't and we didn't. Here we are, a full 1,000 points further down the line in just 2 weeks, and oil is up "only" $5 from where it was back then. If this is our trend (down 1,000 points per $5 in oil) then I'm REALLY concerned about what will happen if oil hits the $150 mark! Note the VERY tight inverse correlation between the price of oil and the Dow.
So, if oil rises 10% more, does that make the market worth 10% less? What if oil rises $60 to the $200 Goldman promised us? Are we in for a 42% drop in the markets? Something has got to give at some point and it's either the price of oil or everything else in the world. We've been betting it would be the price of oil but, for the past 3 weeks, thanks to a long series of Goldman downgrades, everything else in the world has been losing out…
We finished this week with the Dow off 19.9% from its October high after bouncing at the 20% mark in afternoon trading but it wasn't exactly a strong finish. We have noted, however, that this is not the same Dow we had in January as CVX and BAC replaced MO and HON on Feb 19th. BAC, in particular, has dragged the Dow down as it has fallen over 50% since its inclusion and, even worse, it made the Dow heavily weighted to financials with AIG, AXP, BAC, C, GE (1/2 financial) and JPM all acting in concert to drag the major index down for the year.
In the past two months, the Dow has disconnected even further from the more balanced indices, which have been (S&P, NYSE, Nasdaq) relatively flat this quarter against the 8% drop in the Dow. This is certainly not to say things are bad, but are they deserving of the doom and gloom onslaught we are getting from the media? That's why we like to let our Big Chart tell us when to panic, it takes the emotion out. Right now, only the SOX and the Transports are below our bearish 20% line, still looking less sucky than our global neighbors, all of which are already below 20% other than the FTSE.
 There were three things we were looking for to turn the market around; Oil, of course, needs to get back below $120, and Congress needs to pass some meaningful homeowner relief that stops the cycle of foreclosure that is throwing 7,000 consumer families PER DAY out on the streets and, least likely, the administration needs to take concrete action to support the dollar.
It was the disappointing result of the last G8 meeting on the 15th that sent the dollar tumbling from 74.31 all the way back to 72.79 yesterday (2%), which closely correlated with the fall in the Dow from 12,307, down to 11,346 (8%) over the same time-frame. What should be a plus for US exporters has been such a disaster for the Transports and Financials the we have ended up with a very ugly markts – justified or not.
Earnings will tell the tale but they don't begin in earnest until after the holiday weekend on the 7th so next week will, once again, be all about the POO. We'll watch the dollar and we'll watch gold but oil will certainly steer the markets. Our last two bottoms both ended in some form of Federal intervention – January gave us a .75 rate cut and March was the BSC bail-out. Is the Fed out of powder or do they not see any "crisis" worth intervening in this time or do they finally realize they were manipulated by Cramer and Co. to "open the discount window," and effort that succeeded only in boosting the price of oil from $68 as well as other commodities, before the Fed stepped in to "help us" last September, driving the Dow down from 13,500 – the level they were obstensibly trying to protect.
When will this madness end? Aside from oil holding $68 (and on the way down) the CRB was testing support at 300 last September, actually lower than it was in September 2005. We were sold a bill of goods by Cramer, Goldman Sachs and the administration to go yet another $1Tn in debt in order to make their bets on $100 oil come true. Could these really have been "unintended" consequences? Is it really possible that Cramer, Goldman, the Administation and the Fed all put us headlong on a course that, in retrospect, only could have had one possible outcome?
Hank Paulson took over as Treasury Secretary on July 3rd 2006 and we bid a happy 2nd anniversary to the man who. along with his predecessor, John Snow, have overseen the single most rapid decline in the value of the dollar in US history. At the time I warned this would be Paulson's "strategy" as an attempt to devalue the massive US debt run-up by the Bush administration, but I never imagined that it was all just a ruse to enrich commodity speculators…
While our performance for the year has been pretty good, last week was generally awful, especailly for our smaller virtual portfolios, which were generally bullishly poised. Fortunately we cashed out our $10KP at the last expiration and still have a lot of cash to deploy. Other than rolling down existing positions, there simply hasn't been much we've wanted to buy.
- Our Short-Term Virtual Portfolio was the stand-out performer, as our index puts gave us a 10% overall gain on the week, pushing us through the 400% mark, up 408% for the year and back to 80% cash – too bad there's so little to buy!
-
 The Long-Term Virtual Portfolio took a 9% hit on the week as we spent a lot of money to roll down our positons. We were undercovered as I was too bullish and our Stock Club Virtual Portfolio, following a similar strategy, fell 7% for the week as well however, in the Stock Club, we maintained our cash position at 40%, also waiting for a good opportunity.
- Day Trading Virtual Portfolio also took a beating as we dropped 20% for the week and finished 80% invested so we may be back to scratch and all cash if things continue to deteriorate. I suppose, on the whole, being up 30% since 5/19 in this market is not awful but it's a huge disappointment after getting such a good start.
- Our week-old $10,000 Virtual Portfolio is now our $9,300 Virtual Portfolio, down 7% for the week.
- The $25,000 Virtual Portfolio dropped 40% as we stood pat on our positions, our worst single-week performance ever! Our overall performance is up 39% since we started on 2/19 and this virtual portfolio simply cannot get it in gear. We did double up on our cash, now $22,537 – protecting our original investment and giving us more flexibility into next week.
- Stocks Virtual Portfolio is also just a month old and our "boring" strategy, outlined last weekend when we went back to all cash has kept us even for the week. After getting knocked around by the markets this third week in a row, I would encourage members to reread that article and think about how satisfying a nice, safe, 20% strategy can be…
- Complex Spreads actually had a good week, gaining 7% due to a lot of fancy AAPL and GOOG day trading of our covers and we upped our cash position considerably to 85% from 74% last week. On the whole, we're ready for anything – it would just be nice to know what that is!
I warned last Monday that the speculators on the NYMEX had shorted our country 20M barrels of oil in July as they closed the July contracts with just 21Mb scheduled for delivery out of the 7.5Bn barrels they traded during the time it was the fron-month contract. For those of you in government positions I'll do the math for you – that's 99.72% speculation, 0.28% physical demand.
As I said on Monday evening: "The Dow was much worse than it seemed becasue XOM (up 2.8%) and CVX (up 2.5%) added about 50 points to the Dow, which was pretty flat even with their contributions… My bullish premise on the markets is very dependent on oil prices coming down." Now we have to wonder how high they will push this game with a virtual guarantee of a 5M barrel shortfall in inventories every single week of July.
Overall I blame the Fed for the rest of this awful week. We drifted into their meeting nice and flat, consolidating at 11,850. The second that statement came out we lost faith and covered up, which would have been great if I didn't think 11,500 would hold on Thursday and uncovered again, it's a major misplay as I did not believe that the commodity crooks were willing to crash the global economy but, apparently, greed knows no limits with these people.
Of course, since we closed out a ton of callers who got beaten up and stuck with our losers, our performance for closed postions this week was a very strong 33% but the remaining long positions in our virtual portfolio are a sea of red and it's very hard to keep the faith in this trading environment. I've got to stick to my plan and give it until earnings before pulling the plug on 2008, just 4 more trading days until we get the results!
|
Stock |
Description |
Type |
Basis |
Open |
Sale Price |
Sold |
Gain/Loss |
% |
| AAPL | 50 Jul 2008 165.00 AAPL CALL (APVGM) | SC | $ 37,010 | 6/27 | $ 37,730 | 6/27 | $ 720 | 2% |
| AAPL | 50 Jul 2008 170.00 AAPL CALL (APVGN) | SC | $ 42,010 | 6/24 | $ 53,490 | 6/26 | $ 11,480 | 27% |
| AAPL | 5 Jul 2008 185.00 AAPL CALL (APVGQ) | LC | $ 1,760 | 6/25 | $ 1,365 | 6/26 | $ (395) | -22% |
| AAPL | 50 Jul 2008 170.00 AAPL CALL (APVGN) | SC | $ 46,510 | 6/20 | $ 61,240 | 6/23 | $ 14,730 | 32% |
| AMZN | 20 Jul 2008 80.00 AMZN CALL (ZQNGP) | SC | $ 1,610 | 6/20 | $ 1,990 | 6/27 | $ 380 | 24% |
| AXP | 40 Jul 2008 40.00 AXP CALL (AXPGH) | SC | $ 5,610 | 6/20 | $ 11,990 | 6/26 | $ 6,380 | 114% |
| BAC | 80 Jul 2008 27.50 BAC CALL (BACGA) | SC | $ 3,290 | 6/20 | $ 5,350 | 6/27 | $ 2,060 | 63% |
| BHP | 20 Jul 2008 85.00 BHP PUT (BHPSQ) | SP | $ 6,610 | 6/20 | $ 9,290 | 6/24 | $ 2,680 | 41% |
| C | 100 Jul 2008 20.00 C CALL (CGD) | LC | $ 11,010 | 6/20 | $ 8,490 | 6/25 | $ (2,520) | -23% |
| C | 10 Jul 2008 17.50 C PUT (CSR) | SP | $ 430 | 6/24 | $ 740 | 6/25 | $ 310 | 72% |
| COH | 20 Jul 2008 30.00 COH CALL (COHGF) | SC | $ 1,910 | 6/20 | $ 3,190 | 6/27 | $ 1,280 | 67% |
| CY | 120 Jul 2008 28.00 CY CALL (CYGJ) | SC | $ 3,010 | 6/17 | $ 2,990 | 6/27 | $ (20) | -1% |
| DIA | 300 Jun 2008 116.00 DIA PUT (BQQRL) | SP | $ 53,110 | 6/26 | $ 29,990 | 6/27 | $ (23,120) | -44% |
| DIA | 900 Sep 2008 120.00 DIA PUT (DAWUP) | LP | $420,310 | 3/14 | $763,060 | 6/27 | $ 342,750 | 82% |
| DIA | 10 Sep 2008 133.00 DIA PUT (DAWUC) | LP | $ 9,260 | 5/23 | $ 19,640 | 6/27 | $ 10,380 | 112% |
| DIA | 100 Jul 2008 122.00 DIA PUT (DAWSR) | LP | $ 41,010 | 6/26 | $ 62,490 | 6/26 | $ 21,480 | 52% |
| DIA | 200 Jun 2008 113.00 DIA CALL (BQQFI) | LC | $ 60,010 | 6/26 | $ 43,990 | 6/26 | $ (16,020) | -27% |
| DIA | 300 Jul 2008 121.00 DIA PUT (DAWSQ) | SP | $146,120 | 6/20 | $118,780 | 6/26 | $ (27,340) | -19% |
| DIA | 300 Jul 2008 121.00 DIA PUT (DAWSQ) | SP | $105,030 | 6/20 | $116,070 | 6/25 | $ 11,040 | 11% |
| EDU | 10 Jul 2008 65.00 EDU CALL (EDUGM) | LC | $ 1,710 | 6/25 | $ 2,440 | 6/25 | $ 730 | 43% |
| FDX | 10 Jul 2008 80.00 FDX CALL (FDXGP) | SC | $ 1,860 | 6/20 | $ 3,290 | 6/26 | $ 1,430 | 77% |
| FSLR | 40 Jul 2008 290.00 FSLR PUT (HJQSV) | LP | $ 77,410 | 6/23 | $101,970 | 6/26 | $ 24,560 | 32% |
| FSLR | 2 Jun 2008 280.00 FSLR CALL (HJQFU) | LC | $ 1,830 | 5/27 | $ – | 6/25 | $ (1,830) | -100% |
| FSLR | 2 Jun 2008 270.00 FSLR PUT (HJQRZ) | LP | $ 2,600 | 5/31 | $ – | 6/25 | $ (2,600) | -100% |
| GE | 1200 Jul 2008 28.00 GE CALL (GEGA) | SC | $ 42,030 | 6/26 | $137,970 | 6/27 | $ 95,940 | 228% |
| GOOG | 60 Jul 2008 550.00 GOOG CALL (GOPGY) | SC | $108,010 | 6/24 | $147,590 | 6/26 | $ 39,580 | 37% |
| GOOG | 60 Jul 2008 540.00 GOOG CALL (GOPGX) | SC | $150,020 | 6/24 | $183,590 | 6/24 | $ 33,570 | 22% |
| GOOG | 60 Jul 2008 550.00 GOOG CALL (GOPGY) | LC | $129,020 | 6/25 | $149,990 | 6/24 | $ 20,970 | 16% |
| GOOG | 10 Jul 2008 550.00 GOOG CALL (GOPGY) | LC | $ 21,020 | 6/24 | $ 24,990 | 6/24 | $ 3,970 | 19% |
| GOOG | 60 Jul 2008 540.00 GOOG CALL (GOPGX) | SC | $253,530 | 6/18 | $193,790 | 6/23 | $ (59,740) | -24% |
| GOOG | 60 Jul 2008 570.00 GOOG CALL (GOPGQ) | LC | $ 88,210 | 6/23 | $100,190 | 6/23 | $ 11,980 | 14% |
| GRMN | 10 Jul 2008 45.00 GRMN CALL (GQRGI) | SC | $ 1,310 | 6/20 | $ 2,190 | 6/26 | $ 880 | 67% |
| ISRG | 10 Jul 2008 280.00 ISRG CALL (AXVGV) | SC | $ 7,810 | 6/20 | $ 13,990 | 6/24 | $ 6,180 | 79% |
| JOSB | 20 Oct 2008 22.50 JOSB CALL (QZSJX) | LC | $ 8,600 | 4/23 | $ 14,980 | 6/25 | $ 6,380 | 74% |
| LEH | 25 Jul 2008 22.50 LEH CALL (LYHGX) | LC | $ 8,510 | 6/13 | $ 9,740 | 6/25 | $ 1,230 | 15% |
| MCD | 40 Jul 2008 60.00 MCD CALL (MCDGL) | SC | $ 1,210 | 6/16 | $ 2,990 | 6/26 | $ 1,780 | 147% |
| MRVL | 30 Jul 2008 17.50 MRVL CALL (UVMGW) | SC | $ 1,660 | 6/19 | $ 2,540 | 6/27 | $ 880 | 53% |
| MRVL | 30 Jul 2008 17.50 MRVL CALL (UVMGW) | SC | $ 1,660 | 6/20 | $ 2,540 | 6/26 | $ 880 | 53% |
| NBR | 20 Jul 2008 47.50 NBR PUT (NBRSW) | LP | $ 2,210 | 6/24 | $ 3,190 | 6/26 | $ 980 | 44% |
| NYX | 20 Jul 2008 60.00 NYX CALL (NYXGL) | SC | $ 1,110 | 6/20 | $ 2,390 | 6/26 | $ 1,280 | 115% |
| OIH | 10 Jul 2008 220.00 OIH CALL (ODLGD) | LC | $ 5,510 | 6/26 | $ 7,290 | 6/25 | $ 1,780 | 32% |
| PCX | 40 Jul 2008 150.00 PCX PUT (PNZSJ) | SP | $ 38,540 | 6/19 | $ 53,980 | 6/27 | $ 15,440 | 40% |
| PEP | 60 Jul 2008 67.50 PEP CALL (PEPGU) | SC | $ 1,510 | 6/19 | $ 5,390 | 6/27 | $ 3,880 | 257% |
| POT | 40 Jul 2008 210.00 POT CALL (PJNGB) | SC | $ 62,410 | 6/20 | $121,710 | 6/26 | $ 59,300 | 95% |
| QID | 50 Jul 2008 44.00 QID CALL (QIDGR) | LC | $ 5,270 | 6/25 | $ 11,240 | 6/26 | $ 5,970 | 113% |
| QID | 80 Jul 2008 39.00 QID PUT (QIDSM) | LP | $ 7,140 | 6/24 | $ 9,190 | 6/25 | $ 2,050 | 29% |
| SBUX | 60 Jul 2008 17.50 SBUX CALL (SQXGW) | SC | $ 1,810 | 6/20 | $ 5,500 | 6/26 | $ 3,690 | 204% |
| SHLD | 40 Jul 2008 75.00 SHLD CALL (KTQGO) | SC | $ 10,010 | 6/20 | $ 13,190 | 6/24 | $ 3,180 | 32% |
| SNDK | 50 Jul 2008 20.00 SNDK CALL (SWQGD) | SC | $ 6,010 | 6/26 | $ 9,340 | 6/26 | $ 3,330 | 55% |
| SNE | 10 Jul 2008 45.00 SNE CALL (SNEGI) | SC | $ 2,060 | 6/20 | $ 2,790 | 6/24 | $ 730 | 35% |
| TIE | 100 Jul 2008 17.50 TIE CALL (TIEGW) | SC | $ 1,510 | 6/10 | $ 1,490 | 6/23 | $ (20) | -1% |
| TM | 60 Jul 2008 100.00 TM CALL (TMGT) | SC | $ 10,930 | 6/19 | $ 11,690 | 6/24 | $ 760 | 7% |
| USO | 20 Jul 2008 116.00 USO PUT (QSOSL) | LP | $ 19,010 | 6/11 | $ 20,490 | 6/25 | $ 1,480 | 8% |
| UTX | 15 Jul 2008 65.00 UTX CALL (UTXGM) | SC | $ 1,510 | 6/25 | $ 3,815 | 6/26 | $ 2,305 | 153% |
| V | 40 Sep 2008 85.00 V CALL (VIQ) | LC | $ 6,010 | 5/1 | $ 28,590 | 6/25 | $ 22,580 | 376% |
| WFMI | 20 Jul 2008 26.00 WFMI CALL (FMQGQ) | SC | $ 1,470 | 6/20 | $ 2,490 | 6/26 | $ 1,020 | 69% |
| WFR | 40 Jul 2008 65.00 WFR CALL (WFRGM) | SC | $ 9,610 | 6/20 | $ 19,190 | 6/26 | $ 9,580 | 100% |
| WMT | 40 Jul 2008 60.00 WMT CALL (WMTGL) | SC | $ 2,090 | 6/19 | $ 5,390 | 6/26 | $ 3,300 | 158% |
| XLF | 120 Jul 2008 21.00 XLF CALL (XLFGU) | SC | $ 8,530 | 6/25 | $ 18,950 | 6/27 | $ 10,420 | 122% |
| XLF | 120 Jul 2008 21.00 XLF CALL (XLFGU) | SC | $ 11,650 | 6/25 | $ 18,950 | 6/26 | $ 7,300 | 63% |
| XOM | 60 Jul 2008 85.00 XOM PUT (XOMSQ) | SP | $ 6,730 | 6/20 | $ 8,990 | 6/26 | $ 2,260 | 34% |