
 Courtesy of John Lounsbury:
The current official unemployment figure (9.5% for June) should be replaced (or at least supplemented) by a better measurement of actual unemployment. Unemployment should be measured in terms of hours worked by all employees, full-time and part-time. Counting full- and part-time workers equally is giving misleading statistics. Hours per employee, which are changing over time, are not properly recognized in unemployment as currently reported.
Part-time employment for economic reasons – U.S. Dept. of Labor (DOL) terminology – is not directly recognized in the official unemployment rate (U-3). If a person who is working half-time wants to work full-time, but cannot find full-time work, this is the equivalent of half a job lost. The same is true for an employee being forced by an employer to cut half his hours.
 The official DOL unemployment rate counts either individual equally with full-time employees in measuring the level of employment. This was discussed in recent articles (here and here) and will be analyzed in detail in this article. John Mauldin has also discussed this problem is some detail recently (here).
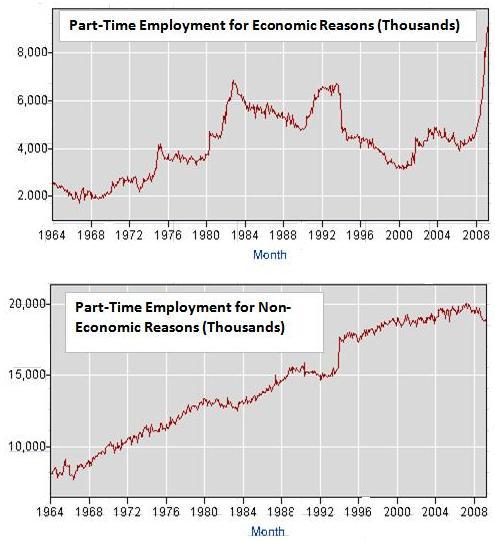
Involuntary part-time employment increases significantly in economic downturns, whereas part-time by choice (“part-time for non-economic reasons” in DOL terminology) is much less changed from its trend roughly proportional to the increase in the workforce with time. This is shown in the following two graphs (from DOL BLS Table A-5).
Note that there is a big jump in the non-economic graph from December, 1993 to January, 2004, presumably from a change in the measurement rules. There is a drop of the same magnitude for employed part-time for economic reasons at the same time. Apparently, at that time, some of the people who formerly would have been counted as involuntary part-time were transferred to part-time by choice.
There are a number of areas that must be examined to try to determine how involuntary part-time employment should be included in what I have chosen to call “implied total unemployment”.
Among these are:
- the definition of full-time employment;
- determination of the average work hours in a part-time week;
- calculation of the implied total unemployment when data is adjusted so that the full-time equivalent number of employed is used; and
- possible changes in the length of the work week over the past decades. These will be discussed in the following sections.
 What Is Full-Time Employment?
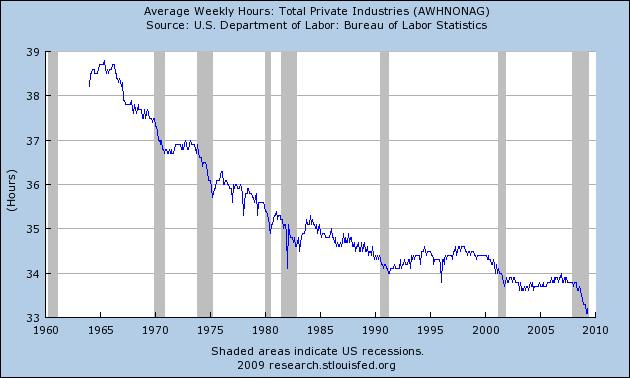
The DOL does not define the length of a full-time work week. They state that is the domain of the employer. It is clear that a full work week must be at least 35 hours for the DOL statistics because all employment less than 35 hours is classified as part-time. The traditional full-time work week used to be considered to be 40 hours, but that may not be the actual practice today when averaged over all employers. The DOL determination of the average work week since 1964 (including part-timers) is shown in this graph:
There was a dramatic drop in the average work week from 1964 to 1984. The decline for the past 28 years was less severe, but minima reached during recessions never recovered to pre-recession levels during this period.
The reason for this drop in average weekly hours worked may be because
- the 40 hour standard was degraded (say from 8:00 – 5:00 with two 15 minute coffee breaks and a 30 minutes lunch to maybe an extra 30 minutes for lunch, a 37.5 hour week); or
- the average part-time weekly hours was decreased (say, for example, from an average of 3 days per week – 24 hours per week – to an average of 2 1/2 days per week – 20 hours per week).
Of course, there may have some of both of these factors operative. Possible interplay between these two factors will be examined in the next section.
 Average Hours in a Part-Time Week
The average weekly hours in a part-time week are calculated by the equations shown in Appendix 1 at the end of the article.
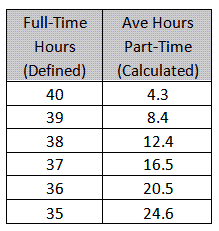
This table shows the relationship between assumed values for average hours in a full-time week and calculated values for average hours in a part-time week. The DOL employment data for May, 2009 was used.
It is clear that the average full-time work week in May, 2009 is not 40 hours, or even 39 because of the calculated values for part-time work week hours. I say this because an average of 8.4 hours or less for part-time work seems unlikely, but I’ll reserve final judgment on that for later. For now let’s assume it is likely that the current average part-time work week is probably between 16 and 24 hours, or the equivalent of 2 to 3 days per week. Those part-time numbers can be valid only for average weekly hours for full-time employees between 35 and 37. When the economy is operating on all cylinders, the average full-time work week may be much closer to 40 hours than it is now.
What Is the Current Implied Total Unemployment?
 The current (May) official unemployment rate is 9.4%, in which each part-timer is counted the same as a fully employed person. This is the so-called U-3 rate. The DOL also reports a broader unemployment rate, named the U-6 rate, which was 16.4% for May. U-6 differs from U-3 by using an expanded definition of the labor force to include the so-called marginally attached, as well as counting the marginally attached and part-time for economic reasons as unemployed.
The relationships used by the DOL for calculating U-6 are given in Appendix 2 at the end of the article.
I propose that a better measurement of employment would be with respect to a full work week equaling one equivalent employed person. This methodology could count a part-timer working reduced hours by choice in either of two ways:
- equal to full-time employment or
- equal to a fraction of full employment.
We will compare the impact on the magnitude of the implied unemployment rate using each definition. In all cases, the impact of an involuntary part-time worker will be a contribution to employment only as the ratio of the average part-time hours to the full-time hours.
The two different ways of calculating the equivalent full-time employment will be called Case A and Case B. Case A considers all part-timers as fractionally employed; e.g., 10 hours per week constitutes 0.25 of an employee, 20 hours per week is 0.50 employee and 30 hours per week is 0.75 of one employee. These fractions apply, of course, for a 40 hour full-time work week. The fractions would increase proportionately for shorter full-time work weeks.
Case B considers all voluntary part-time work the equivalent of full-time individuals in counting employees. In this case, only the part-time for economic reasons (involuntary) part-timers are counted fractionally.
The numbers for the various assumptions for full-time work and the two cases are shown in the following table:
The corresponding unemployment rates, compared to the official U-3 rate are shown in the following table:
Next, the unemployment rates calculated when the marginally attached are added to the labor force are shown in the following table. In this situation, the appropriate DOL rate to compare is U-6:
Finally, if we include all the individuals not in the labor force who are classified as “want work now”, the following table shows the calculated implied unemployment levels. The marginally attached (2,176 in May) are included in the group classified by the as “want work now” (6,454 in May). In this case also, we provide the U-6 rate for comparison:
 I may be old fashioned, but I think the official work week should be defined as 40 hours. This means that, using Case B data, the implied total unemployment corresponding to the official U-3 rate is 14.3% (blue table) compared to the DOL rate for May of 9.4%.
The agreement between the corresponding implied total unemployment and U-6 is considerably better for the two expanded labor force definitions, 15.5% when the marginally attached are included (green table) and 17.8% when all who “want work now” are included (pink table). These two extended labor force calculations bracket the DOL U-6 value (16.4%).
Why not use Case A? I think it is a possible measure of potential total slack in the labor force, but is not a good measure of currently available slack. After all, it is reasonable to assume that most of the people working part-time for non-economic reasons are working as much as they are available or want to work.
However, saying that they are not looking for full-time work is not the same as saying they would not accept more hours, so there may be potential slack in the labor force from people working part-time voluntarily. Perhaps the DOL interview procedures would have to be changed before we would get some information about this potential slack in the labor force.
Historical Perspectives
What would have been the behavior of implied total unemployment during the past 40 years? Before we look at that, let’s review the three widely recognized unemployment rates. The following graph from ShadowStats.com shows how the three measurements have functioned since 1994. Note that there is little difference in the movement of the three metrics; they maintain very closely correlated movement throughout the business cycle.
In the next graph, the implied total unemployment and the official U-3 rates are plotted. The two curves show generally correlated movements, but you may detect variations if you look closely.
Implied Total Unemployment, Blue; Official Unemployment (U-3), Red
The difference between the value of implied total unemployment and U-3 is plotted in the following graph. Lower correlations show up as steeply sloped regions. Since 1980, most of these steeply upward sloping areas have been associated with recessions. This can be attributed to the better accounting of increased involuntary part-time employment by implied total unemployment during economic contractions.
Another factor evident in the above graph is the establishment of a new equilibrium difference between implied total unemployment and U-3 of about 3.5% during periods between recessions. The difference dipped temporarily below 3% during the internet bubble in the late 1990’s. The equilibrium difference moved up during the 1970’s from a level around 1.0% during the 1960’s.
Thus implied total unemployment is showing the impact on work during recessions (shorter work hours, whether from increased involuntary part-time employment or from reduced hours for individuals still classified as full-time). It is also showing the effects of the change in employment practices during the rest of the business cycle. Even during expansions, employers have been using increased numbers of reduced hour workers (involuntarily reduced from the employee point of view) since 1980 compared to the 1960’s.
All of these observations can be demonstrated by doing detailed analysis of hours worked and distribution of the employed among full-time and part-time employment. The advantage of implied total unemployment is that the effect of varying employment practices is shown in a single metric in an intuitively obvious way. This is discussed further in the next section.
 Why Is Implied Total Unemployment Important?
Implied total unemployment is a better measure of slack in the labor force than the generally accepted U-3 number. In an economic contraction, employers not only furlough and fire employees, they also cut back on hours for employees retained. This is not reflected in U-3.
When an economy starts to recover, an employer will increase the number of man-hours worked as demand develops for his products and services. If he has part-timers, the employer is likely to add hours to their schedules before adding additional employees to the payroll. If there is any uncertainty, he will even add overtime before new hires. This has been discussed recently in a good article by Jeffrey Fraenkel (here). Again, U-3 totally misses these labor market changes.
Why not replace U-3 with a better measurement of labor force activity? This process could be started by adding another measurement classification to the analysis currently reported. Maybe call it U-7? Usage of the DOL data in the future will prove whether or not my assertion of value for U-7 is valid or not. If useful in future economic analysis, I will change my nomenclature from “implied total unemployment” to “real total unemployment”.
Appendices
In Appendix 1, basic definitions are given for variables in this analysis. For reference, how the DOL calculates U-6 is described in Appendix 2. In Appendix 3 and 4, the variables and the equations used for calculating U-7, as well as U-7(A) are defined. The U-7 and U-7(A) numbers are in the blue table in the article.
I have also included definitions for two expanded labor force unemployment measures, U-8 and U-9, corresponding to the green and pink tables in the article.
Do not look for U-7, U-8 and U-9 in the DOL data bases. These are my inventions and may never be implemented in the official records of the DOL.
Appendix 1. Basic definitions
Appendix 2. DOL methodology for calculating U-6.
Appendix 3. Data and variables for calculating implied total unemployment.
Appendix 4. Equations for calculating implied total unemployment. Variables are defined in Appendix 3.