Courtesy of Market Tamer
Market Snapshot
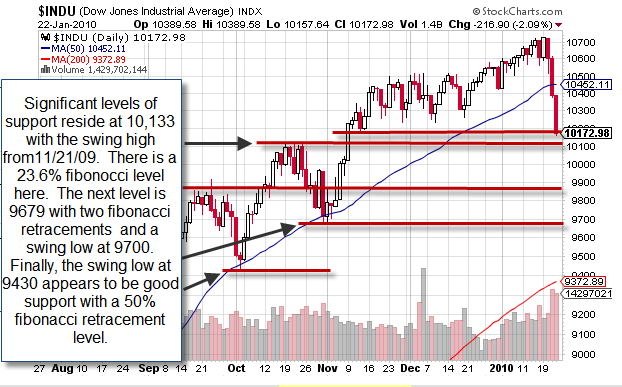
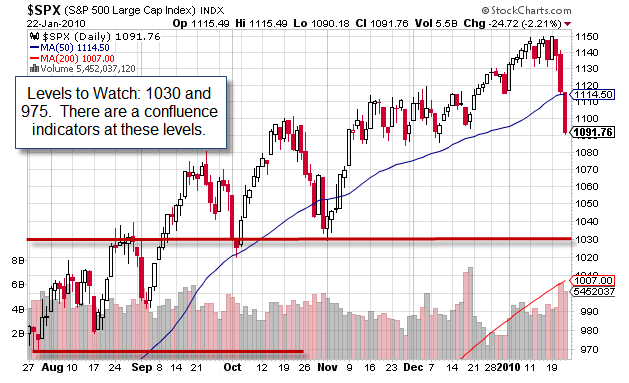
Well, it appears we are getting our pullback as we had expected would happen. We are certainly grateful that we were generously hedged as indicated in last week’s newsletter. This decline may have taken others by surprise but we were ready for it. Our positions are now biased bearish and delta negative. The task is now to determine likely targets for the down move. It is difficult to accurately determine the magnitude and duration of a move such as this one. The place to begin is to identify where a confluence of indicators exists. These are areas where several data points line up to tell us a similar story. While this does not mean that the market is going to cooperate, having a system is important in order to remain disciplined in your decision-making.
It is healthy that the stock market has a pullback. We are long-term bullish, and retracements such as these are crucial to long-term strength. We will simply follow the correction and look to profit from it with bearish strategies, such as bear calls, long puts as well more advanced strategies which we teach at MarketTamer.com. I am reminded of the analogy that the market goes up like an escalator and down like an elevator. The last three trading days certainly support that truism.
As the market approaches target levels noted in the charts, we will begin to take close note of how it reacts at those key levels. Typically, you will see the indexes put in narrower range trading days with less volume at support. Don’t be fooled! The market can do this several times on the way down. If the market begins to stall and trade sideways, it is tempting to remove hedging, only to be surprised by subsequent whipsaws. The safest approach is to wait for upside confirmation before determining that the market has found a bottom. You may miss the exact turn, but don’t let that bother you – safety first is the rule! Do not underestimate the market’s ability to follow through to the downside. Momentum can be a freight train and you don’t want to step in front of it. Just hop on board and ride it to the end of the line.
ECONOMIC REPORTS
MONDAY 1/25
Existing Home Sales
TUESDAY 1/26
Case–Shiller 20 City Index, Consumer Confidence, FHFA Home Price Index
WEDNESDAY 1/27
New Home Sales, Crude Inventories, FOMC Rate Decision
THURSDAY 1/28
Initial Claims, Continuing Claims, Durable Orders
FRIDAY 1/29
Chain Deflator–Adv., Employment Cost Index, GDP–Adv. Chicago PMI, Michigan Sentiment
EARNINGS OF NOTE
MONDAY 1/25
AKS, AMGN, AAPL, HAL, OLN, VMW
TUESDAY 1/26
BHI, ELY, CNI, GLW, DAL, DV, DD, EMC, GILD, JNJ, NVS, NUE, SYK, TLAB, TRV, X, VZ, YHOO
WEDNESDAY 1/27
ABT, ATI, CAT, CTXS, COP, ETFC, FLEX, GD, GMCR, HES, LRCX, MUR, NFLX, NSC, OSIS, PJC, QCOM, RYL, STJ, SYMC, BA, SWK, UAUA, UTX, USG, VLO, WLP
THURSDAY 1/28
MMM, ALK, MO, AMZN, AZN, T, BLL, BMY, BC, CP, CAH, CELG, CHKP, CL, CY, EK, LLY, ETH, F, BEN, GNW, JNS, JBLU, JNPR, KSU, KLAC, LLL, LMT, MSFT, MNRO, MOT, NOK, OXY, OXPS, OSK, POT, PG, RMBS, RTN, RCL, SNDK, TROW, TSM, TDY, TWC, TYC, UA, LCC, WDR, XEL, ZMH
FRIDAY 1/29
ACI, CVX, FO, HON, MAT, NWL, PFS
Weekly Charts
NASDAQ
.jpg)
Dow Jones
S&P 500
Stock Market Insights: The Balance Sheet
The Balance Sheet is a financial statement indicating the strength of the company at a specific point in time. Most companies will report their Balance Sheet numbers quarterly with a year over year summary at the end of their fiscal year. Put quite simply, the Balance Sheet seeks to “balance” two factors. 1) That which is owned by the company and reflected by its assets and 2) that which is not owned comprising both borrowed money (debt and liabilities) and money generated through the equity of shareholders. The Balance Sheet equation is: Assets = Liabilities + Shareholders’ Equity.
Line items that appear under assets on the Balance Sheet can include the following: Current Assets including cash and cash equivalents, Accounts Receivable, Short-Term Investments and Inventory. Current Assets fund the day to day operations of the company. If the company is deficient in this area, it will force them to acquire more debt or initiate a capital raise with additional equity. Long Term Assets include Fixed Assets such as buildings and equipment. It also includes Intangible Assets such as intellectual property and blue sky value like good will. Liabilities include Current Liabilities, Long-Term Liabilities. Current Liabilities include such items as Short-Term Debt, Accounts Payable, Accrued Expenses and that portion of Long-Term Debt that is currently due. Long-Term Liabilities comprise items such as mortgages and business loans.
The final part of the equation is Shareholder’s Equity and that is the part of the company that is attributed to claims that the stockholders have on the value of the company. This value is typically arrived at by subtracting Total Liabilities from Total Assets resulting in the Shareholders’ Equity.
So, as investors, what are we looking for on the Balance Sheet to tell us that the company is worth investing in? An appealing investment would be a company with a large cash position that has been created from business operations, not from the sale of bonds or equity shares and little-to-no debt. We look for a steady rise in inventory to satisfy the demand for the company’s products. Net receivables should be low because that represents the company’s ability to bring cash in the door quickly and efficiently. Next week we will talk about the Cash Flow Statement.
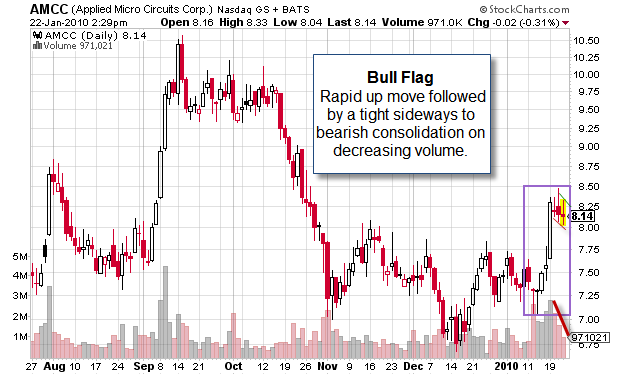
Technical Talk: The Bull Flag Chart Pattern
• The Bull Flag is a bullish continuation pattern that is characterized by a large and relatively quick upside move, followed by profit taking as represented by a tight sideways to slightly bearish consolidation on decreasing volume.
• A Bull Pennant is very similar to a Bull Flag; the difference is that the consolidation is in the form of a small symmetrical triangle. The upside breakout point is just above the upper trend line of the triangle.
• The resumption of the upside move occurs when the stock trades above the high of the flag on increasing volume.
• The consolidation is nothing more than profit taking and should be expected after a fairly large, rapid gain in the stock.
• The stock rises quickly with volume and smart traders begin to take some off the table, which causes the pause. This is normal and expected.
• In my opinion, the Bull Flag is one of the most consistently bullish entries in trading.
• Once the stock breaks the high of the flag your target should be the length of the initial move in the trade (The Pole) added to the top of the breakout point.