
 Was that it?
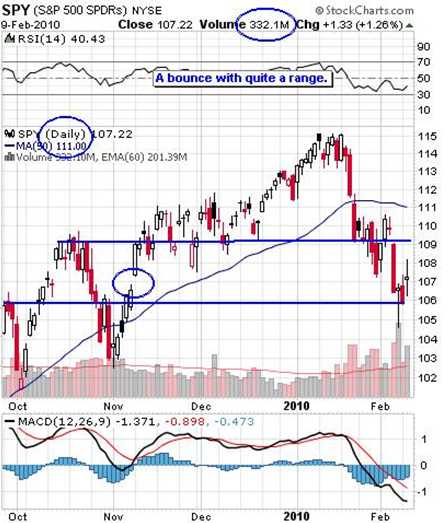
A 10% correction (David Fry chart on right) and we’re done? If so, this is still a fairly bullish market, and it should be, as our sell-off last year was, beyond a doubt, way overdone. Often people forget the fundamentals of investing and the biggest fundamental of them all is: "Where else are you going to put your money?" There many fine companies out there with P/E ratios that are below 15. That means if you give them a dollar, they will return 6.6% in earnings. IBM has a PE of 12, which is an 8.3% return on my money and, according to projections, that will improve to 11 next year, generating 9 cents for each dollar I give them.
Call me an optimist but I think IBM is a fairly safe place to keep my money. Perhaps as safe as 4% TBills, or 7% Greek bonds or 3% Yen Notes or, Heaven forbid, a bank! In fact, not many banks are paying 1.8% on your deposits but IBM does through dividends. IBM was my example trade in the Weeekend Wrap-Up so I won’t get into strategies here but that is what our whole Buy List is about – picking up great long-term values and hedging them to even more effective entries.
Not every stock is as rock solid as IBM but (going back to the Wrap-Up) who did we buy when the chips were down last week? C, CCJ, TBT, GOOG, XLF, AAPL, AMED, CSCO, TM, LOW, AKAM, LLY, NLY, GE, TNA, USO, ABX, DELL, FXI, UYG, BRK/B. Not exactly a radical collection of picks is it? Yesterday, with the market up 2.5% from our shopping spree – we bought NOTHING. Part of the "buy low – sell high" philosophy is waiting for the market to be either high or low. Two weeks ago, on Jan 29th, I charted 10,058 on the Dow as a critical support line and, from our Buy List Update this weekend, I put up the following chart for Members:
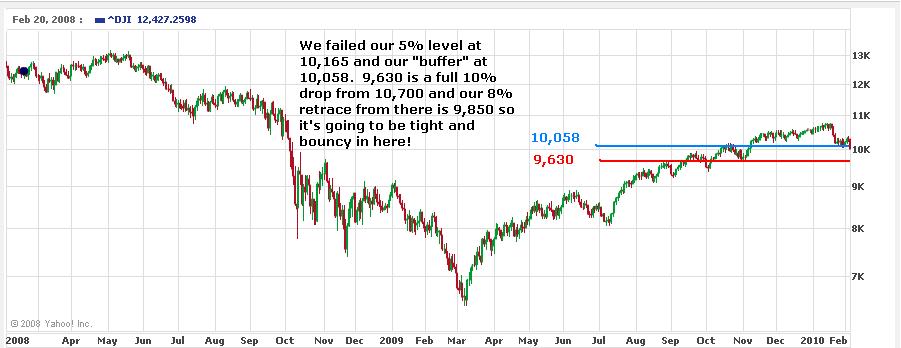
And where did we finish yesterday on the Dow? 10,058. See, this charting thing is easy – that’s why I don’t usually bother, it’s dullsville! Let’s now turn our attention to our other major levels of 10,165 and 10,300 which, keep in mind, is nothing more than our predicted "weak bounce" off the drop from 10,700. As I said in the above chart, we can expect to be "tight and bouncy," which is what we’re seeing this week as we struggle to retake levels we breezed through in early November, when we knew it was a sham as we flew higher on lower and lower volumes.
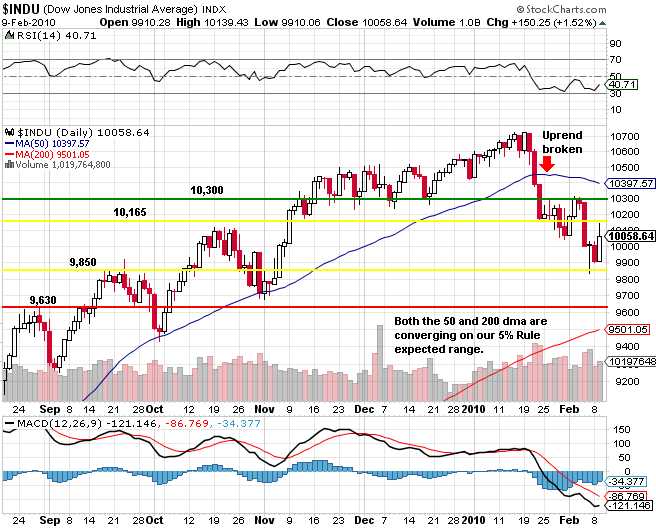
The above trading range is in-line with our fundamental market outlook that is based on the overall VALUE of stocks as a global investment vs other alternatives. The last time we ran a buy list was back in October and we’re happy enough to jump back in here, especially as we are entering our trades using the strategies laid out in "How to Buy Stocks for a 15-20% Discount," which allows us to pick up fine companies here, which HOPING we get to double down if another panic takes us below 9,650.
 It does look like our range is solid though and we’ll see how well is holds up over the next couple of weeks. The second chart I posted for Members this weekend was the chart of the Dow during 2004, a year I feel we may be repeating as we struggle to get out of the recession backed by plenty of government stimulus. Through October of 2004, the trend was choppy and down and that’s why we’re pursuing mainly market-neutral strategies for now.
Asia was up this morning with the Shanghai leading with a 1.14% gain, followed by the Hang Seng at 0.67% and the Nikkei at 0.31%. Not a very good reaction off of our fun day and, as with the US, it was a commodity led rally so nothing to get excited about. Japan had a 20.1% increase in Machinery Orders in December and China had an 85.5% increase in IMPORTS in January. “Earnings across the region reinforce the view that the recovery is gaining momentum,” said Stephen Halmarick, Sydney- based head of investment-markets research at Colonial First State Global Asset Management.
China suffered form the same trade disease as we did in December – rapidly rising commodity costs. Oil peaked out at $82 a barrel in December and copper was up more than 10% from the prior month. China’s Trade Surplus fell to $14.17Bn while the US trade deficit rose to $40.2Bn, up 10% from November. What’s really incredible about these numbers is the fact that economists missed them by miles. How do they fail to take rising commoidtiy prices into account when projecting trade data? Why should we trust any of the work they do if this is how they perform?
Europe is performing well again this morning with 1%+ gains across the board as Greece seems on the way to being rescued but that isn’t stopping Civil Servants from striking over there, shutting down government services including shipping and airports (no customs). This was expected and we talked about it last week so no big deal other than to the Euro, which has no reason to rally on more stimulus news and a new problem child going on the EU dole.
Until Greece is fully resolved, we can still expect the market to jerk up and down in our ranges and it still looks like healthy consolidation to me – all within our expected ranges so far….