Insider Buying and Selling Trends
By Ilene
A reader recently alerted me to this article, "The inside Track, Commentary: Corporate insiders are betting this is a correction," which suggests that insiders are taking a renewed interest in buying shares of their stock.
One of the most bearish omens on Wall Street is for corporate insiders, in the face of a market decline, to accelerate the selling of their companies’ shares.
That would mean that they have no confidence that those shares will recover any time soon and have decided to unload their shares, even at depressed prices.
That’s why analysts have been paying close attention to insider behavior since the stock market began correcting in mid January.
Fortunately for the bulls, they did not sell more stock into that decline. On the contrary, recently released data show that insiders have not only cut back on their selling, but also increased the pace of their buying.
This suggests that they believe that their companies’ shares will soon be going back up in price…
For the week ending Jan. 15, for example, which was the week in which the stock market hit its high, this sell-to-buy ratio was 5.15-to-1, which meant that insiders that week were selling more than five shares for every one that they were purchasing.
For the week ending Feb. 12, in contrast, according to the latest issue of Vickers Weekly Insider Report, the ratio was less than half as high, at 2.42-to-1.
Because of this marked improvement in the sell-to-buy ratio, David Coleman, Vickers editor, views "the recent downturn as likely being only a near-term correction. We remain cautious, but are increasingly optimistic about the future performance of the overall markets."
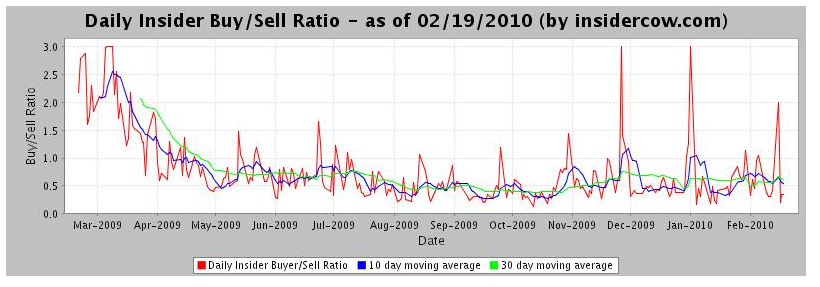
Other than a brief spike in the buy/sell ratio (chart 4 below), I don’t see much support for the thesis that insiders are buying up noteworthy amounts of stock reflected in the insider buying and selling trends. It seems more like there was a brief pause in selling, causing a brief spike in the buy/sell ratio. Take a look at the charts below–buying in dollar amount, buying in share number, selling in dollar amount, and the ratio of buying to selling. It seems to me the conclusion that insiders are showing a build-up in confidence is a bit premature (if not entirely unfounded) based on these data.
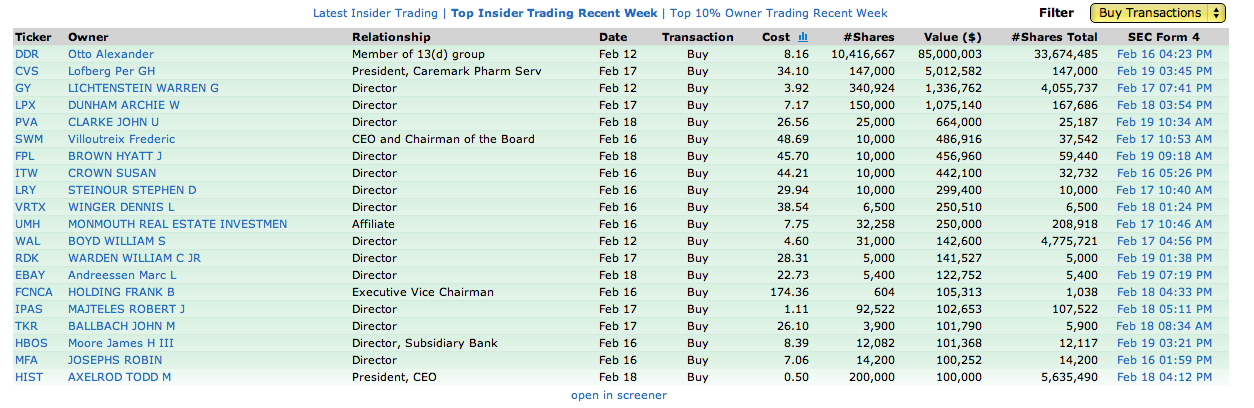
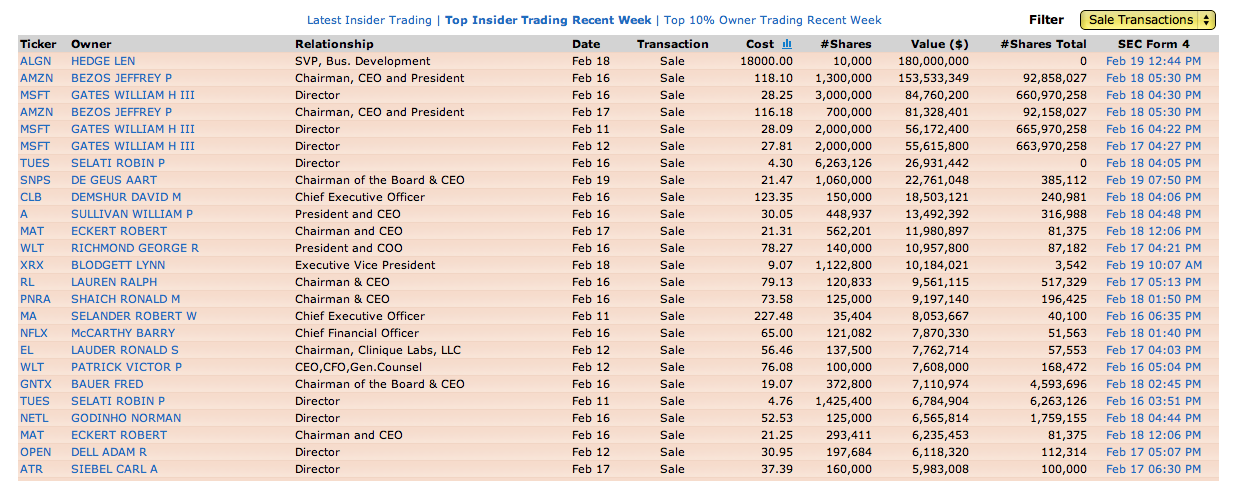
Finviz has more data, go here for a list of recent buys and sells. (See charts five and six).
Chart 1.
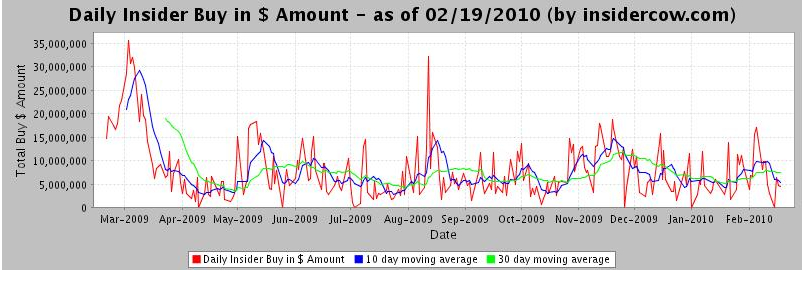
Chart 2.
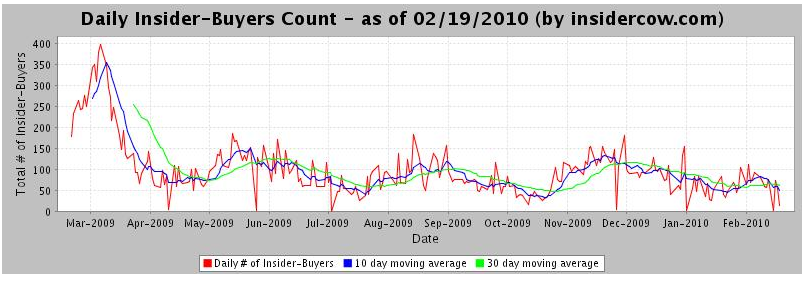
Chart 3.
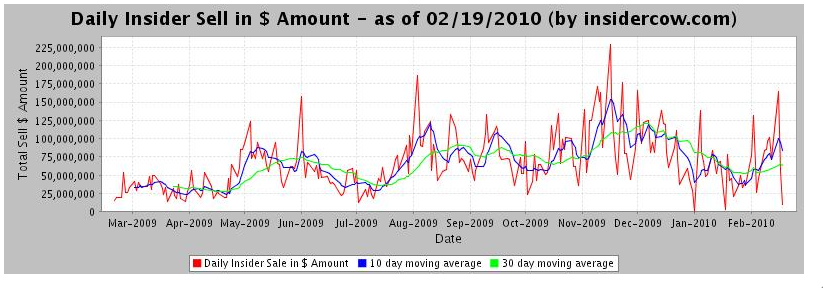
Chart 4.
Click on charts 5 and 6 for Finviz’s larger charts. Chart 6 is actually a lot longer than the image captured here.