
What a wild last 30 day's we've had!
I'm going to do a little bit of charting today so we don't miss out on the next potential Meatball Market (where bad news "just doesn't matter") as we get past earnings season without any serious dings. Of course, like Icarus, they higher we go, the further we have to fall, especially when we're getting there on wax wings but part of our fundamental outlook is looking at market sentiment along with the motives, means and opportunity of the manipulators.
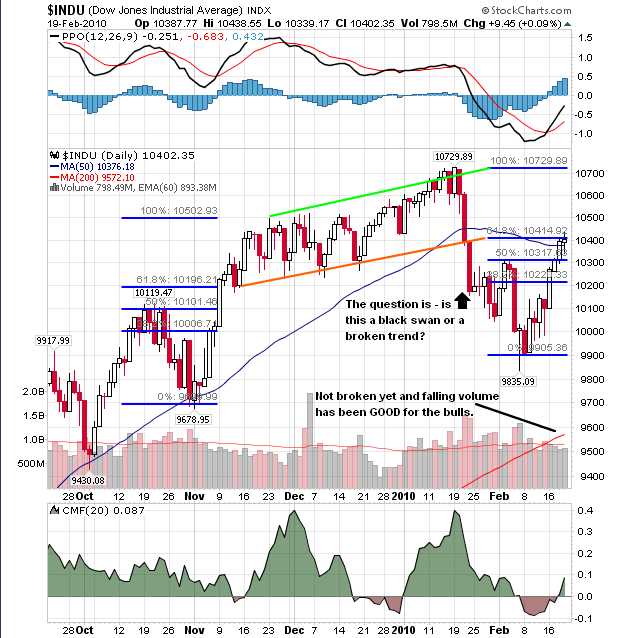
The Fed threw a little monkey-wrench into the works Thursday with a surprise rate move but the market was amazingly unphased and, as you'll notice on the chart below, we are neatly repeating the same move we saw in early November, when we waited 400 points for the correction that never came – until January 20th of course! This week, we took a few pokes at short plays and got burned and we went into the weekend a little bearish but mostly neutral. Our Buy List is off to the races, of course and only 2 of our 42 trade ideas there (AGNC and DF) are off course – I had meant to do an update this week but there's no point!
We don't pay much attention to the Buy List in our daily posts or even in chat because those trades do their job with very little fuss. Ideally, the bulk of your virtual portfolio should be made up of boring, low-touch trades that make nice, consistent returns and THAT allows us to have fun with our more aggressive short-term plays that do demand our regular attention. Someone asked me about allocation the other day and I said that, generally, I feel 75% should be in long-term, well-hedged positions like the ones on our Buy List while the other 25% should be used for more opportunistic trading and, generally, we rarely stray from keeping 1/2 of that in cash to remain flexible.
Of our aggressive virtual portfolio, we try to keep our allocations to no more than 10% of our cash on new positions (which means the more trades you make, the less you put into the next trade) and limit our losses to 20% of a full position or 2% of that virtual portfolio MAX. 2% of 25% is 0.5% of the total virtual portfolio. If our Buy/Write Virtual Portfolio is on track, then 75% of our capital is making at least 2% a month in a nice, steady manner while we can have FUN with the rest. I spend a lot of time trying to talk new members OUT of gambling so I think it's important to remind folks, once in a while, why our Virtual Portfolio Tab has our latest Buy List on it and not a bunch of day trades.
In a crazy, choppy market like this one, we do a lot of day trading and short-term trading and, as you can see from the the Weekly Wrap-Up, those can be very profitable. But do not confuse gambling, which is what short-term trading is, with investing. Investing is studying stocks and finding ones you want to be in for the long-haul. Investing is identifying value and having a plan to build a position in winning stocks over time. Our current Buy List began Thanksgiving weekend, when we decided we were ready for another leg up and, on updates, we highlight which of the 42 make the best current entries.
On our 2/6 update, we were not liking AGNC or DF. My comment to Members on AGNC was " Best to see if they pull back a little now but totally great if you are in them from last time." Our original entry was at $26.20 on 11/24 and they have since paid a $1.40 dividend (12/29). I thought the Q4 earnings were very good and the company's main concern was that their borrowers would pre-pay their mortgages, forcing them to roll over to new loans. I do still like them at $24.80 and we can sell the September $25 puts and calls for $4.70 to lower the basis to $20.10 and, if AGNC is below $25 at September expiration, we have another round put to us at $25, for an average entry of $22.55, which is 9% less than the stock is now. If we get called away at $25, it's a 25% profit plus, in either case, the bonus of the anticipated $1.40 dividend at the end of March and May. If all goes well, we will "roll" the contracts we sold out to longer dates, allowing us to collect the September dividend while continuing to lower our basis.
How do we balance our long-term position in AGNC? Aside from the options we sold to hedge our position, we can also utilize our short-term virtual portfolio to make offsetting trades. Last week we made a short-term trade shorting IYR and this week we went back in on some SRS. Not every trader makes every trade but, if your main virtual portfolio has AGNC and other real estate plays – then a short-term opportunity to profit from a dip in CRE is ideal. The vulnerabilities of your long-term virtual portfolio should guide your betting in your short-term virtual portfolio!
Now, there is a more aggressive way to play AGNC for a new entry. We can buy the Sept $22.50 calls for $2.55 and sell the Sept $25 calls for $1.10, which is a net $1.45 entry on the $2.50 spread, which gives us a potential payoff of $250 for each $145 invested (72%). Of course, if AGNC falls below $22.50 at September expiration, we end up with nothing for our troubles – that's why these plays are gambling! If you are not sure, a good rule of thumb is A) Investing doesn't pay you 72% in 6 months and B) If you are not buying a tangible asset, you are gambling.
 "Hey Phil", you may ask, "are you good enough to turn this gamble into an investment?" Of course I am! This is what PSW is all about – TEACHING our Members to fish… Here's a simple idea for this trade – take the above spread and it's 72% upside potential and add to it the naked sale of the Sept $22.50 puts at $2. That changes our basis from a $1.45 debit to a .55 credit and reduces our break/even on the trade from $23.95 ($22.50 + $1.45) to $21.95 ($22.50 – .55), an 11% improvement! Now your profit on the play is $3.05 at $25, or $305 for your cash commitment of -.55 and your margin requirement (on TOS – always check with your broker) of $460. So, roughly a 75% return on cash + margin in 6 months and your worst-case scenario is you have AGNC put to you at net $21.95 (11.5% below the current price) on Sept 17th (expiration day), just 2 weeks before collecting (hopefully) a $1.40 dividend.
Do you see the difference between gambling and investing? We're making a commitment to own AGNC in the more complicated spread but they didn't make our Buy List for no reason – we WANT to own them long-term and this is a nice, mellow way to test the waters for an initial entry. If we follow good practices of scaling into a position, we're only going to allocate, at most, 50% of a full position (which is, at most 10% of cash) to our initial entry. Let's say a 10% allocation was $10,000. That means we're going to normally allocate $2,500 to this entry but, since we're opting not to do a buy/write, where we purchase the stock in round one, we can commit to a 2x purchase at $21.95. That means we buy 2 bull call spreads and sell 2 puts.
With $4,390 (if 200 shares are put to us) allocated to this entry, we use a grand total of $810 in margin for the first 6 months while the rest is unused cash in our virtual portfolio, giving us useful margin flexibility in other trades. If all goes well, we make $610 (2x $305), which is 75% off margin and 13.8% against our committed level. That's in 6 months! If 75% of your virtual portfolio is in nice, mellow trades like this – you can see how we can afford to have fun with the other 25%…
 The key to managing your virtual portfolio with option entries like this is you make as much money as you would if you bought the stock BUT and it's a BIG BUT (which I like) you still have 80% of your commitment in cash. So, IF the market goes the wrong way, you have that $4,200 of cash ready willing and able to go with the flow, whether you cash out the long trade or not. If you know your virtual portfolio and are clear on your allocations and balance, then it's relatively easy to slap on an ETF cover to slam your virtual portfolio into neutral to ride out an event or even tip it the other way and profit from the move against you. Once the bottom is found, those downside momentum profits can be used to dollar cost average into your "losing" long trades.
I say long because we are generally long on the markets now (hence the huge Buy List) but we do expect a rocky year and it always pays to be prepared. For the most part, we set up our Buy List to make about 10% per quarter unless the market drops more than 10% – that helps us ride out most negative moves and, over the years, we push our basis so low on the longer-term positions that we no longer care about their current price – just about how much they will make us selling calls each month and/or paying dividends each quarter.
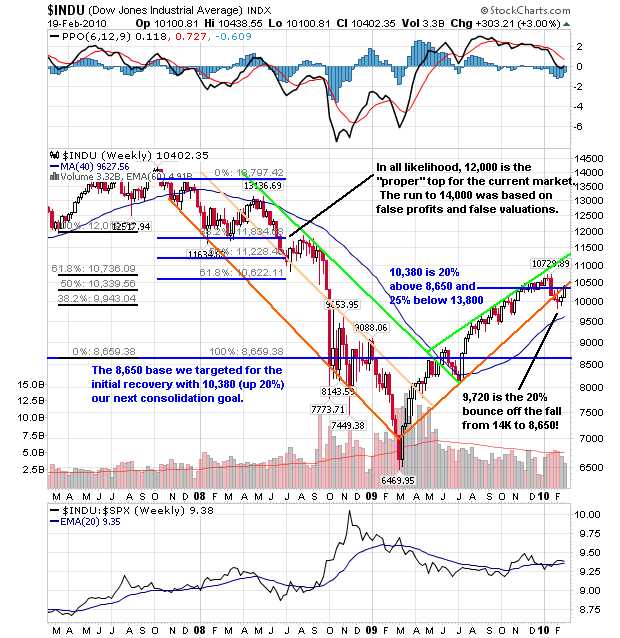
Notice how our recent pullback coincides with the low Fibonacci chart (the one that assumes 12,000 is the market top) rather than the extended version that TA people use as they tend to assume the Dow's move to 14,000 was "real" even though it was based on Trillions of dollars worth of accounting shenanigans. I prefer to throw out bad data – like the data that told us the world was ending between Nov '08 and March '09. I feel confident doing this as it turns out the world is still here but do forgive me if that doesn't mean I'm going to jump on that 14,000 bandwagon either.
 Adjusting Dean Foods
DF, our second miss from the Buy List, is another one we soured on to the point they didn't make the 2/6 write-up. When I first picked them on 12/21, they were looking steady but we went cautious with a Jan buy/write that gave us a net entry of $13.43/15.42 by selling the Jan $17.50 puts and calls. Another trade we looked at was the Jan $12.50s at $5.50, selling the same $17.50 puts and calls for $4.20 for net $1.20 on the spread. I had soured on DF as they were on the wrong side of our 2010 investing premise outlined in "A Tale of Two Economies" as they are one of those companies caught in the squeeze – trying to sell to the impoverished bottom 90% of American society while suffering themselves from rising commodity prices.
Still their nasty 2/10 drop off gives us a good chance to discuss adjustments for when you are in a trade like that and the stock suddenly drops 20%. Step 1 is "do we still like the stock?" That's a funny question because I wasn't liking them at $18 on 2/6 but I like them better now at $14.63. As I say to Members, it's like buying jeans on the discount rack – sure they have a small tear but for 20% off I can live with it… DF lowered their guidance for the year by 5% and the stock fell 20%. Meanwhile, we are now within $3 of their spike low of Nov '08 and they were $22 last summer so, not a terrible stock for the price.
In the buy/write position at $13.43/15.42 – the question is, do we think they can recover to $17.50 by January? While our break-even is $15.42 on this trade and we are at $14.63, it's still a good idea to see if adjustments can be made. The Jan $17.50 calls have fallen to .80 while the $17.50 puts have gone up to $3.60 – not a big change in the total (was $4.20) but the underlying stock fell from $17.68 to $14.63 so a net loss of 24% ($3.25/$13.43) on the trade. If we are scaling in and have a 1x position here – then it's a 24% loss on 2.5% (max) or 0.6% so cutting and running is sensible if we can't come up with a more attractive plan.
The two main adjustments to stick with a trade like this are to either adjust the targets or stay aggressive and DD. Since I'm not very confident in DF at the moment, I'd rather lower our targets and that's surprisingly easy as the Jan $17.50 put and call combo is $4.40 and the Jan $12.50 puts and calls are $4. Rolling the short straddle down $5 adds .40 to our basis but, of course, drops our put-to price so we move from net $13.43/15.42 to net $13.83/13.17 – a bit more comfortable with the stock at $14.63. We'll assume we can add stock or roll our callers longer if DF recovers but there's no reason to Double Down here, at $14.63 as DF does not pay a dividend. If you are really gung-ho to own 2x on the stock, you can simply sell the 2012 $12.50 puts for $2, which means you will eventually DD at net $10.50 and that would put you (assuming you are assigned in Jan at $13.17) in 4x at an average of $11.84.
This is not a terrible outcome for a stock you began scaling into 12/21 at $17.68 with an allocation of 4x (say 400 shares at $7,072) and in Jan 2012 you end up with 400 shares x $11.59 for $4,636 – that's 34% off in 2 years! If you had bought all of your long-term holdings for 34% off would you be doing better in your virtual portfolio? These are calculation you should do BEFORE entering any kind of long-term position. If you are NOT willing, ready and able to follow your initial entry through to it's logical downside conclusion – why would you buy the first entry at such a high price?
Now Let's Apply That Logic to New Purchases
I like VLO at $17.89 and I will LOVE VLO at $11.80 (34% off) if someone is foolish enough to sell it to me for that price. In fact, If I were to allocate the same $7,000 we have in the DF example to VLO and I ended up with 400 shares of VLO for $4,720, I already know I would be happy to do yet another buy/write and "risk" having another 400 shares put to me for another 20% off (9.44), which would give me 800 shares of VLO for an average of $10.62 or $8,496. At that point, I can project that I'd get about the same premium at TSO ($12.23) commands now and the May $13 calls can be sold for .75. If I can sell May $11 VLO calls for .75 off my $10.62 basis then I'm collecting $600 PER QUARTER off my $8,496 investment or 28% a year until I'm unlucky enough to get called away. Keep in mind this is our "worst case" scenario for the stock (assuming nothing catastrophic, of course).
VLO hasn't spiked as low at $13.49 in '08 and there are no guarantees but if you keep working your way into blue-chip positions like this, you can build up a hell of a virtual portfolio from all the "losers" over the years! When we're scaling in we're generally disappointed if the market takes off on us as we don't get the opportunity to build our positions cheaply and we have to "settle" for our quick 10-20% gains on 1/4 positions. Since I KNOW that's how much I like VLO it sort of makes buying the stock for $17.89 and selling the Jan $17.50 puts and calls for $4.75 for a net entry of $12.75/15.13 sort of a no-brainer as an entry for a 1x position, doesn't it? Just like in chess, once you get used to looking 3 or more moves ahead, spotting good current opportunities on the board becomes a lot easier!
Also note that this is a fairly aggressive buy/write entry on a stock we really like. All VLO has to do between now and January is hold $17.50 and we make the spread between $12.75 and $17.50, which is $4.75 or 37% of $12.75. Going back to our above note – making 37% in one year is GAMBLING, not investing! As a 1/4 scale on a stock you really love, you can be forgiven for a little gamble but consider that you can buy the stock for the same $17.89 and sell the Jan $15 puts and calls for $5.20 for net $12.69/13.84.
What that adjustment does is lower your upside potential to $2.31, still a reasonable 9.7% but it also lowers your potential 2x entry by 10% and now you make that 9.7% if VLO holds $15 through Jan (down 16%) vs POSSIBLY making 37% as long as VLO doesn't go down at all with profits occuring between $15.13 and $17.50. Many things come into play here: Our overall market outlook, how correlated we think the stock is, where we are in our scale (we take less chances as we get more committed) and, of course, how we feel about the fundamentals going forward. In the case of VLO, 37% in the bush does seem to be worth risking 9.7% in the hand…
BUT (another big but), if you don't work through these calculations BEFORE you enter a trade, if you don't develop a trading plan for up, down or neutral markets – then you are doomed to be "surprised" every time your positions move on you. In the above trades I've outlines – we're pretty much HAPPY whether our stock goes up, down OR stays put BECAUSE WE HAVE A PLAN to make a profit in each direction. Since 40 of our 42 Member selections from the Buy List ARE working and right on track to make 10-20% – you can see how we have plenty of time to get into deep detail on the 2 that aren't!
Worth the Risk?
Despite the bullish-looking chart action noted above – we still have some serious economic headwinds to contend with so I continue to favor not only allocating the bulk of the virtual portfolio to buy/write type plays (see original "How To Buy Stocks For A 15-20% Discount" for overall strategy) that pay 10-20% on a flatline or even with a 10% cushion as described above but I continue to advocate disaster hedges (just reviewed in the Weekly Wrap-Up) – just in case.
By giving ourselves 15-20% downside protection built into our bullish stock plays and adding another 10% downside protection by allocating 10% of the virtual portfolio to disaster hedges that give us at least a double if the market dips just 10%, we are able to ride out a drop all the way from 10,000 back to 7,000 while staying about even. As we learned last year (and the year before) having cash at the market bottom can make for some excellent trading opportunities (the Karn Evil 9 school of investing) and we are not out of the scary woods yet so we'd rather take some fairly conservative overall returns unitl (if ever) things calm down.
 We'll feel better if our bounce levels (pretty much where we finished the week) start acting like support but I'm thinking we consolidate within 2.5% of our 5% lines (Dow 10,165, S&P 1,088, Nas 2,200, NYSE 7,000 and RUT 620) all the way through next earnings at which point we will either be seeing positive jobs numbers or looking for nice, self-sustaining tropical islands to move to. In fact, the NY Times this weekend noted that millions of people face years of continued unemployment and 2.7M people will run out of benefits by April unless our gridlocked Congress approves another extension.
Our state and local governments are feeling the strain ($134Bn in projected budget deficits) from supporting 18M (the real number) unemployed people and their families at the same time their tax base is dwindling and overall, the economy is in a state of DEflation, not inflation which does not bode well for a rapid return to former market glory despite what the commodity pits would have you believe. China tightened twice as much 2 Friday's ago as our Fed did last Thursday and John Mauldin reminds us that we're not done worrying about Europe just yet.
 Despite Obama's plan to funnel $1.5Bn of foreclosure relief into the market this year, January saw a record drop in the median price of existing home sales in Orlando of 14%. 14%!!! If you thought you have seen the bottom in housing prices – think again as the banks have been driving prices lower as they dump the properties that have been dumped on them, possibly trying to get ahead of the end of the Fed's support programs or possibly something to do with January as our previous record fall in housing prices came last January so we'll be very concerned if February doesn't show a big improvement.
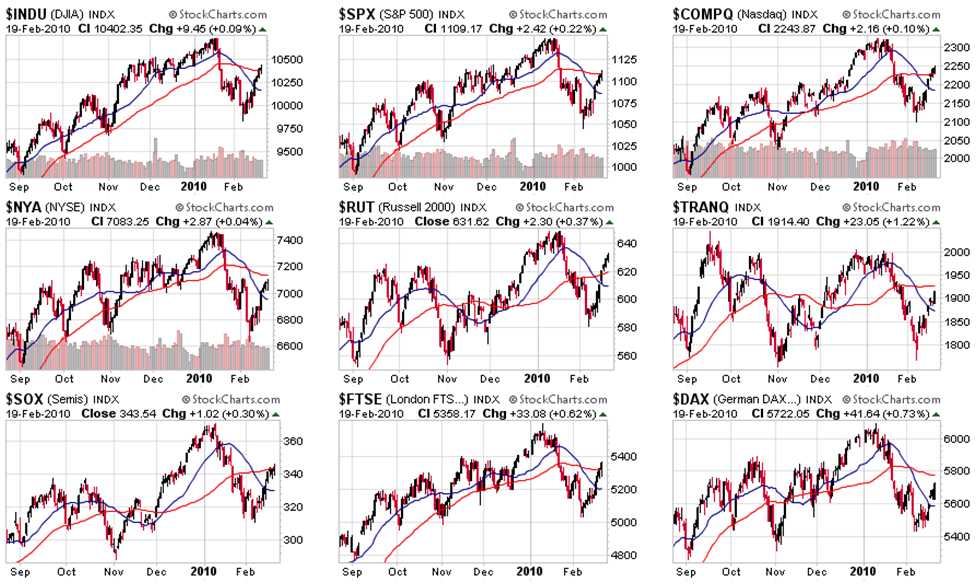
Our indexes still have a lot to prove so let's watch those red lines (200 dmas) with the Hang Seng looking like our weakest indicator at the critical 20,200 mark (declining 50 dma) with the Transports (1,925), the DAX (5,750) and the NYSE (7,100) all having something to prove if we're going to buy into this global rally story:
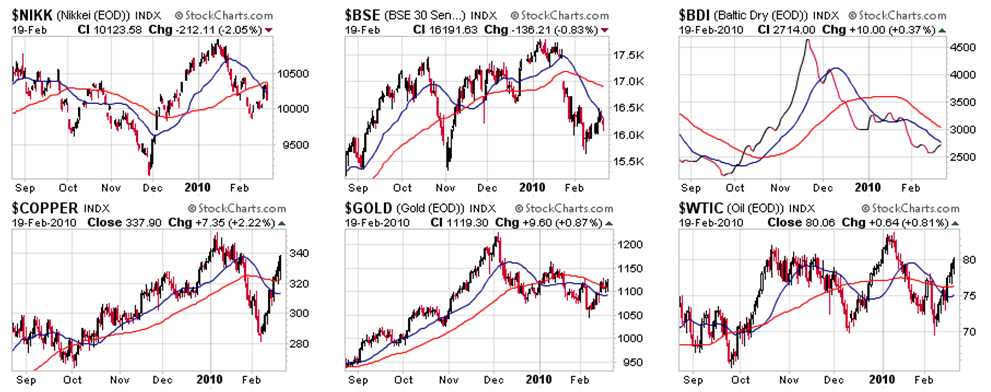
What kind of rally can it be if we are not making progress on the Nikkei (10,400), the BSE (16,500) or the Baltic Dry Index (3,000). After all, if the commodity pushers want us to believe that prices should be back near last year's highs – why wouldn't shipping rates be at least 2/3 of last year's highs – or, is it pure speculation driving these markets with no actual demand for physical product delivery??? We do have several shippers on our Buy List – just in case…
Keep in mind that our economy is being driven by stories about how great things are in China and India and India and China are being driven by stories about how great things are here while the Europeans are told how great things are in Asia AND America even though they themselves are miserable and we are told we're very lucky not to be in Europe, where socialism is really screwing things up (although somehow Communism is the engine of global growth?), especially that nasty health care system that gives them, on average, a 5% longer life expectancy than us (but you spend those extra years waiting in line at the doctor's office is the official GOP joke).
So, whether we are worried about too much safety net bankrupting Europe or not enough safety net creating a nation of Joe Stacks over here, it does pay to remain cautious until we start seeing firm support above those red lines across the board.