
David Rosenberg: The S&P Is Going To 850, And There Are 10 Leading Indicators That Are Now Rolling Over Right Now
Courtesy of Vince Veneziani and Joe Weisenthal at Clusterstock
 From this morning’s Breakfast With Dave note, Rosenberg presents the basic argument that what goes up big will come down big:
There have only been two other times when the stock market ran parabolically up from a low in barely over a year, as was the case this time around (+80% from March 2009 to April 2010): the 112% surge from June 1, 1932 to September 7, 1932; and the 116% runup from March 2, 1933 to July 18, 1933. In the first case, we had a 40% correction and in the second, the
correction was 34%. So, we are talking here about the prospect of a pretty hefty reversal in the S&P 500 that could very easily take the index down to as low as 850, if the history of these types of givebacks is any indication.
The problem for Mr. Market is that it went into this latest Europe-induced ordeal with an excessively bullish GDP growth outlook for the U.S.A. – at the April highs, we would argue that a GDP growth rate of 6% was effectively being
discounted. How nutty is that?
So, where next?
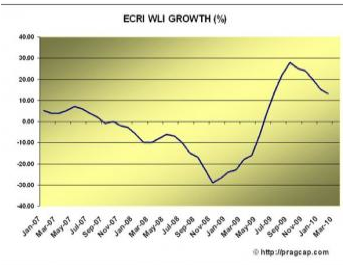
In the aftermath of the correction, the equity market is now pricing in a growth rate closer to 3.5% — the fact that earnings have been rising while the market has been correcting has helped cut the degree of overvaluation in half, to a 0.5 standard deviation from 1.0 just over a month ago on a Shiller normalized P/E ratio basis. But the ECRI leading economic index is actually foreshadowing a deceleration in real GDP growth, to 1.5% in the second half of the year from the 3.75% average pace since the recession technically appeared to have ended around mid-2009. The S&P 500 level that would be consistent with that sort of pace would be closer to 850 than the current level of 1,074. In other words, there is still more air to come out of the balloon.
As for the signs of slowing growth…
Click to see the 10 real-time indicators that are rolling over >