
For more background information on why Rick collects his data and what he believes it reflects, please see my previous Interview with Rick Davis of the Consumer Metrics Institute, if you haven’t already. – Ilene
Consumer Demand Slowdown Gets Even Weirder
Courtesy of Rick Davis at Consumer Metric Institute
We have been commenting for some time that the profile of the current year-over-year contraction in consumer demand has been unique when compared to similar events in 2006 and 2008. The differences have only become more distinct as time has progressed:
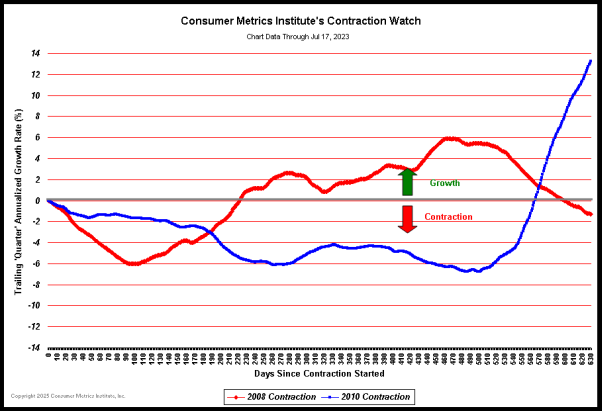
(Click on chart for fuller resolution)
• The 2010 event has now gone on for nearly 150 days without forming a bottom. The 2006 event had already completely ended by the 110th day, while the much more severe 2008 event had at least formed a bottom by the 120th day. In contrast the downward slope of the 2010 event increased after passing the 140th day.
• The 2010 event has now passed the 2006 event in terms of maximum level of contraction. In 2006 our ‘Daily Growth Index’ bottomed at a year-over-year contraction rate of -2.28% on August 25th. On June 10th, 2010 our ‘Daily Growth Index’ dropped below that level for the first time during the current slowdown.
• The severity of contraction events is the product of the average negative ‘growth’ rate observed and the duration of the negative ‘growth’ period. This means that the two-dimensional ‘area under the curve’ is the best true indication of how much economic pain is associated with each event. In 2006 our ‘Daily Growth Index’ had a total of about 136 negative-percent-days of contraction over the 110 day event, and the BEA’s measurement of the GDP dropped to a barely positive .1% growth for the third quarter of 2006. During the current 2010 contraction event we have already accumulated over 210 negative-percent-days of contraction during the first 148 days, a figure that is more that 50% greater than in 2006 and still growing. (To keep these figures in perspective, however, the 2008 event reached 794 negative-percent-days of contraction over 223 days. This means that the current slowdown, although already 2/3 the length of the 2008 event, has to this date inflicted only about a quarter of the damage to the economy as experienced in 2008.)
• What is troubling to our eyes is that the shape of the current curve is clearly different from both the 2006 and 2008 events, which were similar except for scale. Put bluntly, our recent past experience with contraction events can offer no predictions as to where we are headed now. Something is structurally different this time.
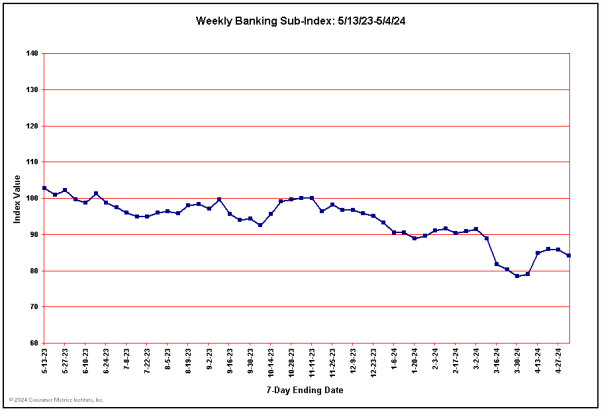
That said, what is different this time? As we have mentioned in previous posts, consumers are clearly more cautious/concerned about debt. And they have recently shown more interests in conventional banking products than at any time over the past year.
All of this points to structural changes in the aggregate behavior of U.S. consumers, perhaps even the ‘sea-change’ suggested by Stephanie Pomboy last September during an interview with Alan Abelson in Barron’s.
Regardless of the underlying behavioral reasons, the the ‘V’ shaped bounce that we experienced in both 2006 and 2008 is less likely this time around. Instead of a hit-and-run blizzard, we’ll probably see a siege of bone chilling fog that long overstays its welcome.