
Reminder: Sabrient is available to chat with Members, comments are found below each post.
DARK HORSE HEDGE – Where Do We Go From Here?
By Scott Brown at Sabrient & Ilene at Phil’s Stock World
Let's all get together soon, before it is too late
Forget about the past and let your feelings fade away
If you do I'm sure you'll see the end is not yet near
Where do we go
Where do we go
Where do we go from here?
After a week of meandering along the 200 day MA we find ourselves wondering where we go from here? The market indicators we use at DHH to guide our Long/Short tilt seem to be running out of steam as the MACD 12-26-9 and RSI look close to rolling over, though they haven't yet. These are both lagging indicators to help us avoid being whipsawed. Relying on short-term indicators lately would have resulted in whipsawing action, especially since the 2010 highs in April. If the markets are unable to clear the tower at 1130 on the S&P 500, we will most likely see a retest of the 1040 range quickly. There in lies the basis for always having both long and short positions, so that we are able to generate Alpha (measure of return on a risk adjusted basis) which ever way the wind blows.
Please read an excellent analysis of the "New Long-Term Buy Signal" by Carl Swenlin. Carl discusses the new buy signal and its recent tendency to fail to follow through.
Long Positions
The DHH virtual portfolio currently holds AXS, DLX and TEO as longs only, i.e., with no options written (sold) against them. These positions are likely to participate if the market breaks through resistance and rallies in a sustainable way. We would add other Long positions to tilt 67% Long if the S&P 500 breaks out above the 200 day MA, above 1130, and stays above it passing our "hysteresis test." If, on the other hand, the index fails for a third time since April to clear the tower then the S&P 500 will most likely move back towards the 50 day MA and eventually retest the 1040 level.
We also hold FRX, WDC, GME, and XRTX Long, but as covered calls for yield enhancement. GME options were rolled from October $20 calls to December $20 calls last week adding another $.88/share in option premium. WDC is the only of these four with calls expiring on October 15. We will look for an opportunity to roll the WDC call options forward for additional yield.
We recommended using Phil's Buy/Write Strategy when we added GCI, IM, VECO and WFR to DHH, attempting to increase Alpha with our 15-20% discounts. We currently have half of our ultimate full Long position in each of these four stocks, having sold both call and put options. Read this for an example of how this strategy works. If the sold put options get exercised, we will end up holding a full position for these stocks. Only VECO's options are set to expire on October 15. We acquired half of the shares in VECO for $31.93 and secured $6.20 in option premium by selling calls and puts with $32 strike prices. VECO, despite being downgraded by Avian on September 8, closed Friday at $35.36. So we will monitor the option premiums closely heading into October for chances to roll them forward. If VECO stays above $32, we will end up with a 20% profit in October, and the stock will be called away.
Virtual Portfolio Long positions in the news this week included: GME, WDC, FRX and XRTX. XRTX will announce quarterly results on September 29, 2010.
GME – http://finance.yahoo.com/news/FedEx-Ford-Pulte-GameStop-are-apf-1789214054.html?x=0&.v=2
FRX – http://www.nytimes.com/2010/09/16/health/16drug.html?ref=health#iframe_height=300
WDC – http://finance.yahoo.com/news/
Short Positions
Our current short positions are AIV, BKS, CLDA, JOE, SCOR, SGEN, TEX and USG.
On Monday, Sept. 13, Seattle Genetics (SGEN) announced that its potential leukemia drug failed to meet its goals in a midstage study. Its goal was to extend overall survival. The drug will not be further developed. The Burrill Report reported in Seeking Alpha:
"Seattle Genetics (SGEN) said a mid-stage trial of its experimental drug to treat acute myeloid leukemia failed to extend overall survival. The Bothell, Washington-based company said it would discontinue development of lintuzumab, a naked monoclonal antibody that targets the CD33 antigen. The company said it would continue to focus on advancing its lead product candidate, brentuximab vedotin and other products in its pipeline. The company is expected to report top-line data from two brentuximab vedotin clinical trials within the next six weeks. The company hopes to submit an application to the U.S. Food and Drug Administration in the first half of 2011 for clearance to market the drug."
It is hard to justify a $1.2 Billion market cap for SGEN. The company does have some important cancer drugs in clinical trials, but until it proves it can generate products and revenue, it will remain on our Short list. Interestingly, ThinkEquity initiated SGEN with a BUY on August 31, 2010 only to downgrade the stock to a HOLD two weeks later on September 14, 2010. Brean Murray and WBB Securities initiated SGEN coverage in 2010, WBB Securities with a SELL and Brean Murray with a HOLD.
Our virtual portfolio is currently balanced approximately 50:50 long/short. If the S&P 500 breaks through 1130 and remains strong next week, we will issue recommendations for altering the virtual portfolio tilt to the long side.
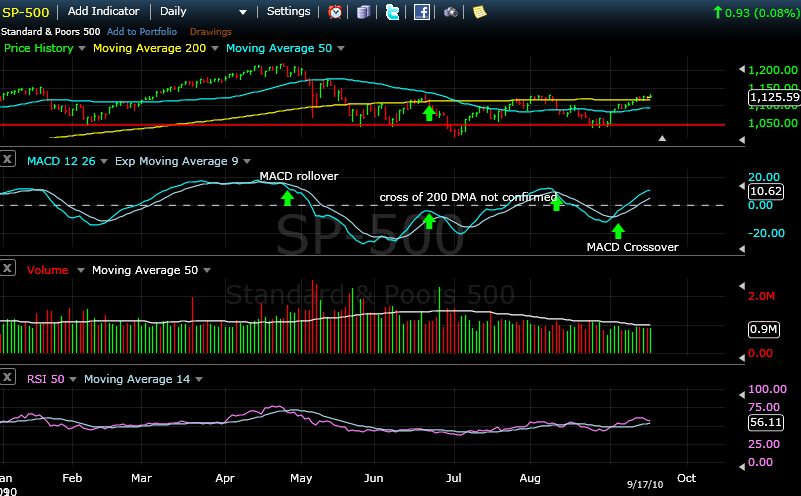
Chart by FreeStockCharts.com
About Dark Horse Hedge
Dark Horse Hedge (DHH) is a virtual portfolio created by Scott Brown at Sabrient and Ilene at Phil’s Stock World. It is based on Sabrient's highly successful and popular Investors’ (H)Edge product. The DHH virtual portfolio is a Long/Short virtual portfolio taking advantage of technical market trends to tilt the long/short balance in bearish, bullish and range-bound markets.
Long and short equity positions taken in DHH are chosen using Sabrient’s rating system, which is primarily based on fundamental criteria. Because stock positions will generally be held for long periods, these positions are ideal for using with option strategies taught by Phil Davis, of Phil’s Stock World.
The DHH newsletter follows a number of guidelines in an attempt to increase Alpha (return) while minimizing systemic risk, or “Beta.” Beta is a measure of the volatility of a virtual portfolio in comparison to the market as a whole. To keep beta low, the DHH virtual portfolio holds both long and short positions. Consequently, dramatic moves in the market will always be in the direction of at least part of the virtual portfolio. (Read more about Alpha and Beta here.)
Using Sabrient’s rating system, we focus on being long high quality stocks, and short low quality stocks. Long positions generally fare better than average during market selloffs. In contrast, short positions, selected from the lowest ranking stocks, should perform well during selloffs. This strategy is designed to balance the goal of attaining Alpha with the desire to keep Beta relatively low.
Following the trend works best when there is a trend. When there is no trend, attempts to follow it result in whipsawing action, losses, and frustration. So in addition to aiming for high Alpha and low Beta, we use a hysteretic method to confirm trends.
Hysteresis refers to systems that have memory, where the effects of the current input (or stimulus) to the system are experienced with a certain memory for the previous input and a certain delay in reaction time. Hysteresis is defined as “the phenomenon exhibited by a system in which the reaction of the system to changes is dependent upon its past reactions to change” and as “the lag in response exhibited by a body in reacting to changes in the forces.” Using a hysteretic formula, we look for confirmation of a trend beyond breaking across a Moving Average on a given day. We consider the direction of the movement across a MA, and support from indicators such as MACD and RSI, to avoid being whipsawed as indexes trade along their 50-day and/or 200-day MA. Using this method, we delay altering the tilt of our virtual portfolio until the movement is confirmed by multiple variables. As noted, DHH is currently balanced and we will continue to watch the market, waiting for a possible confirmation of signals to tilt more to the long side.