
 A Trillion Dollars – Muhaha!
After adding $209Bn (26.3%) in total assets so far this year, the US ETF industry has passed the Trillion Dollar mark led by $31Bn of inflows into fixed income ETFs, of all things as well as $29Bn of inflows into emerging markets, and $21Bn into domestic. Recent outflows have knocked commodity ETFs down to $11.4Bn, miles down from last year’s $32.6Bn inflow – rats leaving a sinking ship, perhaps? That would be very bad news for the firm that bought up 90% of the LME copper supply recently. Do ETF traders really know something or are they a lagging indicator?
“There is little doubt that money chases performance, so the bedrock for significant (ETF asset) growth is clearly a continuing move higher for risk assets,” said Nicholas Colas, chief market strategist at ConvergEx Group. He added that growth for ETF assets would essentially be a “tug of war” between hedge funds and retail investors. “As retail investors grow more confident in a continued rally in risk assets, they will shift capital from cash to equity ETFs,” said Mr Colas, who described growth for equity focused hedge funds as the “other side of the growth coin” for ETFs.
Mr Colas noted that hedge funds tended to use ETFs on the short side which was negative for asset growth. He said that as hedge funds expanded their equity trading books, a growing portion would come from from ETF short sales. “This will come through as ‘supply’, dampening demand for new shares.” Barry Ritholtz ponders the end game of the ETF madness and concludes that soon there will be more ETFs than ever:
There is growing speculation surrounding what is believed to be the next breakthrough product in the ETF marketplace: Single stock tracking ETFs. Unlike their index-based cousins, these new single stock trackers would, as the name implies, track only a single stock, trade at exactly the same price as the stock to which they’re linked and consequently eliminate the need for single stock ownership. A top executive with a money management firm who is familiar with his company’s plans to launch such a product and was granted anonymity so he could speak freely, put it this way: “Think about the prospect of, say, a GE tracking ETF — an investor could capture over 99% of the movement of GE while simultaneously forfeiting any claim to a dividend and paying us up to35 basis points to manage the ETF. What’s not to like? We think this product paves the way for the ETF marketplace to collect its next trillion in assets.”
 Of course it’s all about the fees. ETF’s seem "safer" than stocks and they do have a lot of diversification benefits. We are long on XLF and FAS because we sure don’t want to place a big bet on any particular bank but, as a group, we think they are in recovery mode. When we short – we like to short DIA, TZA, SPY, QID, etc. on general bets the indexes will pull back (as if that EVERY happens!) yet we rarely go long on index ETFs other than very short-term as we usually know how to pick a good stock for ourselves, thank you very much, that will outperform a whole index.
As you can see from the chart on the right, ETFs are, generally, better than Mutual Funds from an expense perspective but some ETFs, particularly utlra-ETFs and commodity ETFs churn those fees over and over as they constantly roll their positions and that leads to inefficiencies that can really damage your returns over time. Take a look at oil vs. USO – a 10% divergence over just 200 days. Drag the days out longer and see what happens to the tracking…
Go out 600 days and you’ll see that, since the crash in March 2009, USO has diverged in performance from oil by over 100%. That’s why we like to short USO – over the long run, it’s a pretty good bet! Not all ETFs are poor trackers, GLD tracks physical gold very well and always has while DIA diverges from the Dow by 2% over 200 days – but to the upside! That’s an indication of how enthusiastically investors are piling into index ETFs. Since the crash, DIA has outperformed the Dow by 10% – now THAT’s an ETF! We had shorted DIA because I expected them to "true up" into the end of the year but no such luck as they keep flying. Bottom line – use these charts to look at your ETFs before you buy – it will help you avoid the lemons, like USO, that are out there.
 The real problem with having $1Tn worth of US ETFs out there (and who knows how many foreign ETFs are holding US equities?) is that, as happened in 2008, should investors begin cashing out, they will create waves of indiscriminate selling – just as we currently have waves of indiscriminate buying. If you wonder what kind of idiot would own NFLX at $186 – it’s probably you, as well as me, as we probably have some 401K or IRA that’s tracking the S&P or the Nasdaq and NFLX is in both.
I mentioned in yesterday’s post that we’d be shorting NFLX once the Cramericans were done piling in and we had a trade in yesterday’s Morning Alert that’s ready to go now but I also like selling the WEEKLY $185 puts for $1.85 and buying the Jan $170 puts for $3.40 as the delta differential is only .19 and you have the very great advantage that the weekly puts expire tomorrow. Since the Jan $165 puts can be sold for $2.35, the plan is to roll down to a vertical if NFLX dips below $184 before the expiration but, otherwise, it should be a nice, profitable 1-day trade.
NFLX is being pumped up daily by CNBC and I’m counting on them to hold it for another day, of course. I was going to go off on CNBC this morning but Gary A wrote such a great article on HubPages that I have nothing more to add other than: you should really read this post. The first Cramer video is very apropos as I thought it was yesterday’s show but it turns out it was from June of 2008, when the S&P was also at 1,250 and there’s Jim picking the same stocks at about the same levels for the same reasons he’s picking them today – very funny (unless you followed his advice in June of 2008, of course).
 Have I mentioned I like cash lately? Yes, I know, had we not gone to cash we wouldn’t have missed out on this 100-point rally in the Dow since November 4th. We also wouldn’t have missed the 500-point drop from Nov 4th through Nov 30th but who remembers that any more? What we do remember is this "incredible rally" except that the rally actually consisted of the Dow jumping 250 points on Dec 1st, another 120 points on the 2nd, 30 more on the 3rd and then 100 points over the next 12 sessions. As we’re now heading into a 3-day weekend with another holiday weekend after that – I’m still liking cash. We’ve been poking around with short-term short plays as the possible reward for catching a dip was pretty high but it’s not worth risking over the weekend and we’ll have to patiently wait to see what the new year will bring.
Asia was flat this morning and the good news is the FTSE gained 60 points (1%) after the open but the bad news is they opened down 1% so Europe is flat as well. Since a single person now holds $3Bn of the LME’s $3.3Bn worth of copper – there doesn’t seem to be much point in watching that for any kind of real economic indication and we already know oil is a manipulated joke with an hysterical 305M barrels on order for February delivery even though when January closed on Tuesday, just 18Mb were left with 114Mb worth of contracts canceled in 5 days of trading (90% seems to be about the right level of fake demand by speculators that’s ballooning the commodity markets in general) – just as I predicted on Thursday, the 16th. We did very well shorting oil off that $89 line for the week but that’s over now as we have to wait for a new channel to form while the February contract cycle tops out. Not hard, you just have to be patient…
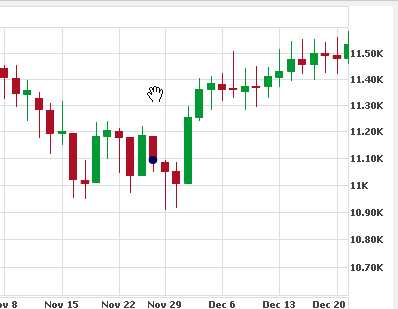
We had a great run into last year as well and it didn’t have a happy ending but it did last until options expiration day on January 18th. As I pointed out to Members in last night’s Chat, if this is the beginning of a rally to S&P 1,550 or even 1,450 – we’re not missing much by sitting on our hands at 1,250 and we did have plenty of long plays last week so now we’re just waiting to see if the breakout sticks. Interestingly, we remained bearish last year because the Dow could not break my 11,539 target in January and yesterday they finished right at 11,533 so it only took them a year to confirm the breakout (or form a nasty, long-term double top, of course). Gang of 12 Member DB said the US economy would grow 6% in 2010 on Jan 14th and we went into that weekend bearish with Monday being Martin Luther King Day and that Tuesday, the 19th, I warned that the markets were "shell-shocked" and unable to hear bad news or, in the very least "comfortably numb." Here’s what happened next:
.jpg)
Like Cramer, I could almost say the same exact thing I said last year now and for pretty much the same reasons and, like Cramer, I would have pretty much the same fool saying the exact opposite as I am at the same time. I wonder who will "win" this round? In "news for the numb" this morning we have US GDP at 2.6%, less than one-half of DB’s prediction for the year yet we’re STILL at 11,500 on the Dow. We also have Q3 Corporate Profits off a whopping 25% of estimates at 2.4% (vs. 3.2%) yet we’re STILL at 11,500 on the Dow and MBA Mortgage Applications fell 18.6% this week after falling "just" 2.3% last week despite the fact that the 30-year rate flatlined at 4.85% yet we are STILL at Dow 11,500.
Existing Home Sales are at 10am but it must be hard to buy a home without a mortgage and we also get the FHFA Housing Price Index at 10 and then Oil Inventories at 10:30.
Be careful out there!
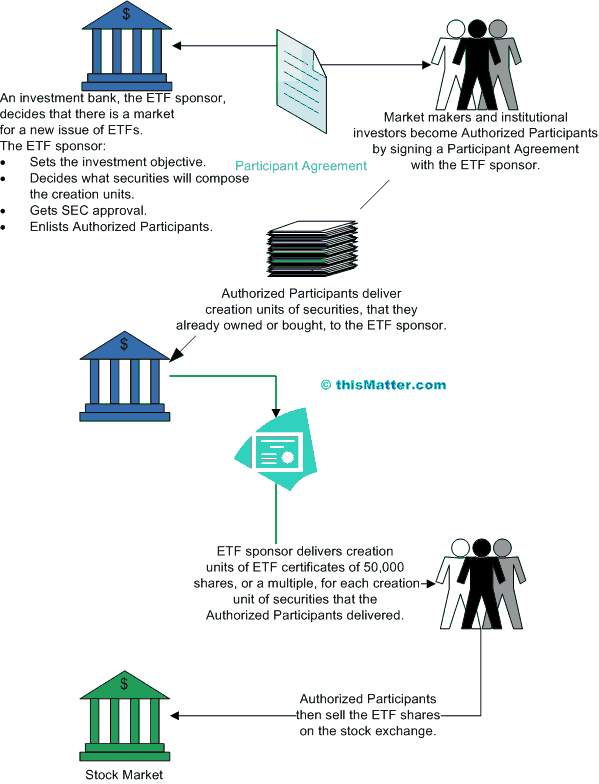
ETF chart by thismatter.com