
Reminder: Harlan is available to chat with Members, comments are found below each post.
Believe it or not we have a lot of positive structure showing up in the charts. First up here are the 10-minute time frequency index charts.
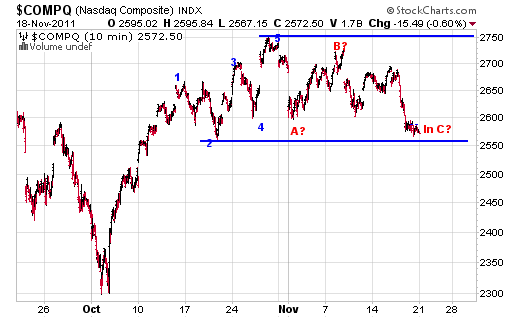
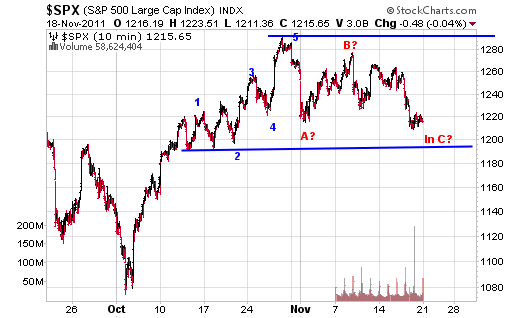
As you can see not only have we got the ABC’s showing we even have more of a sideways range going on over the last six weeks.
Moving on to the 60-minute index charts.
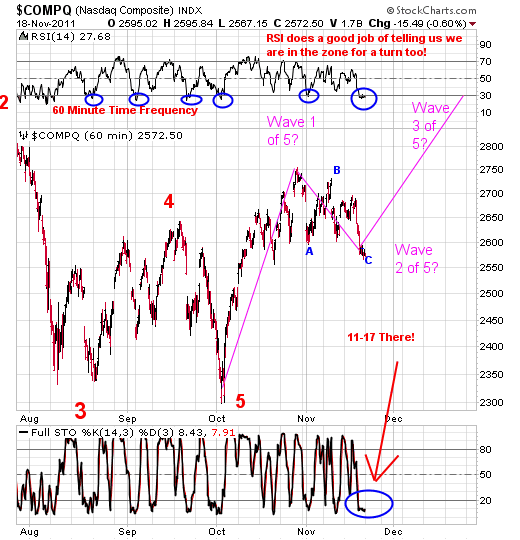
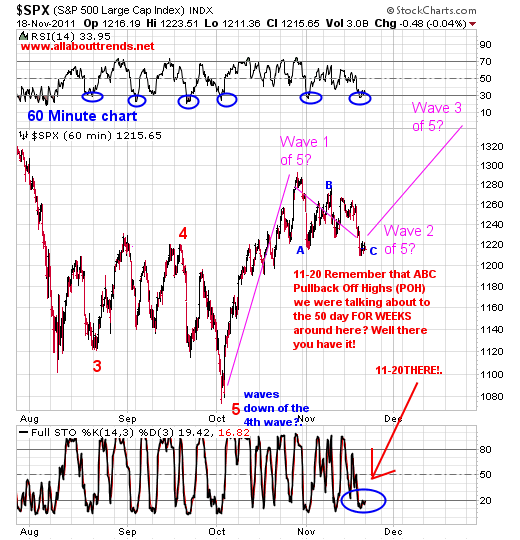
In this set of time frequency charts we see the RSI (At the top of the chart) indicator in the oversold zone. We’ve highlighted every low with a blue circle and as you can see it normally does a good job of marking a low zone on each index pretty consistently. The same can be said for the Full Stohcastics as well.
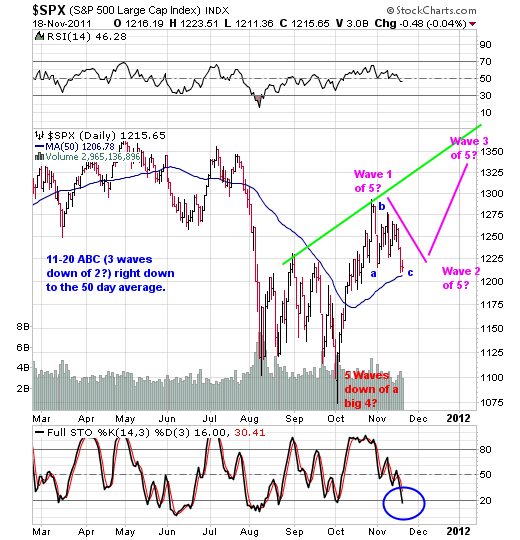
Moving on to the daily time frequency.
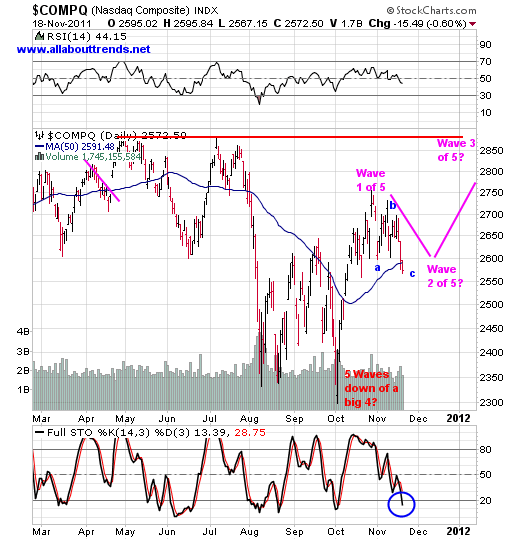
So we go into next week with a lot of positives.
1. The RSI on the ten minute charts are sporting oversold
2. The Full Stohcastics are in deep oversold not just in the 60-minute time frequency but also in the daily time frequency. This confluence doesn’t happen a lot.
3. The ABC three waves down of wave two.
4. All indexes are pulling back to the 50-day average zone (RUT and DOW are very tight and orderly)
This is the classic technical structure we look for around here. Friday was also the 3rd down day and we have a saying around here as a rule of thumb and that is:
"On the third to fourth day watch for a reversal."
We are in that window folks.
We even have another ingredient too kicking in –FEAR.
As for the super committee next week? Expect more talking turkey bickering (think noise) and nothing getting done with automatic cuts taking place. And yes the EU will still be burning. That’s going to go on for a long time.
That all said what if one were to filter out that noise and just look purely at the technicals of the market? How much of that fear in you would disappear? How much clearer could you be thinking? There are tons of decent looking charts out there with structure but if your most precious asset (state of mind) is being clouded and short circuited with fear and the like how can you even see clearly?
How would you be objectively looking at things? Simple, all you have to do is read everything above as that is what we’ve done for you.
On Friday we said:
"Now it’s just a matter of the market playing ball here. We have great positions and all were bought on pullbacks where we didn’t have to chase them but were able to allow them to come to us. Now comes the hard part. Doing nothing with them."
And that is what we are going to do with them given the technical backdrop we are seeing out there. What we’ll also want to do is stick to our discipline and look to add to positions next week. The first three names on our long side watch list have a lot of classic All About Trends POH structure.
==============================
SHORT SIDE WATCH LIST
NONE
==============================
LONG SIDE WATCH LIST
"Only The Best And Forget The Rest "
"We Trade What We SEE, NOT What We Think, Hear Or Fear "
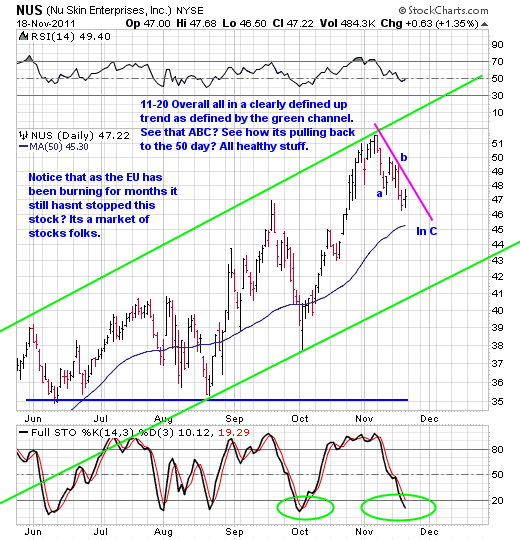
11-20 In uptrending markets it’s all about stocks in clearly defined uptrends above the 50-day pulling back off highs. Those are the best ones. And folks that is exactly what we are seeing with these top names.
FCX and RIO get put on the back burner in favor of better tighter looking patterns. Should they build out bigger patterns we’ll bring them back
NUS
BACK ON HE LIST
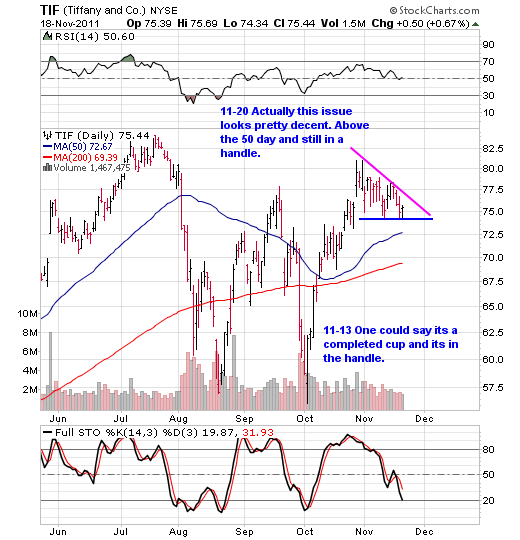
TIF
BACK ON HE LIST
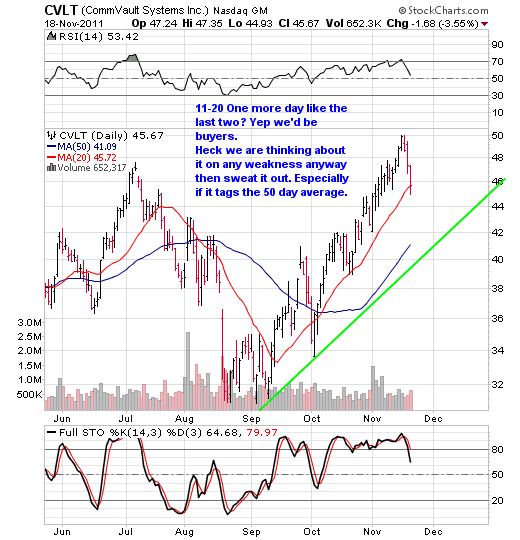
CVLT
BACK ON LIST
NUAN
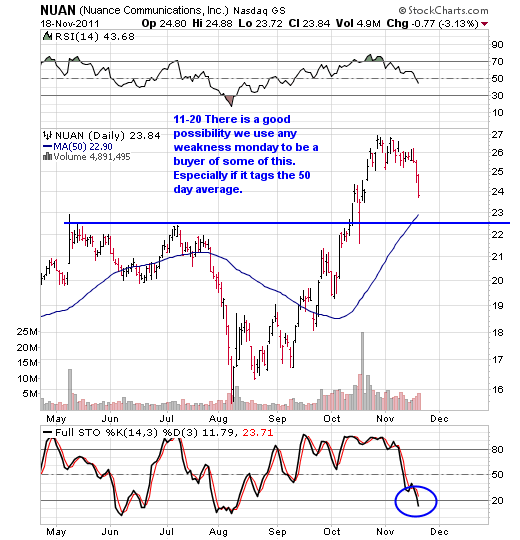
11-20 CVLT and NUAN are a bit different in the sense that they have more of that slam down to the 50 day type consolidation going on but none the less a Pullback Off Highs pattern and both oversold. Market weakness at the open on Monday MAY be the ticket with each of these.
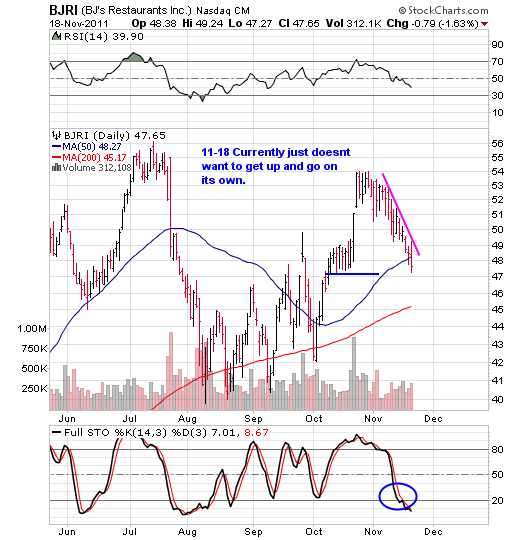
BJRI
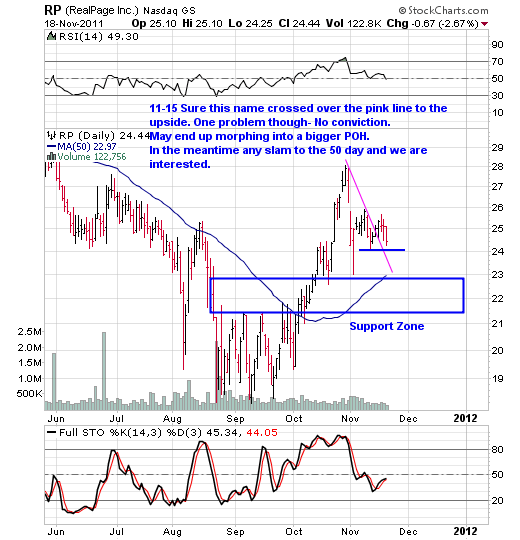
RP
FOSL
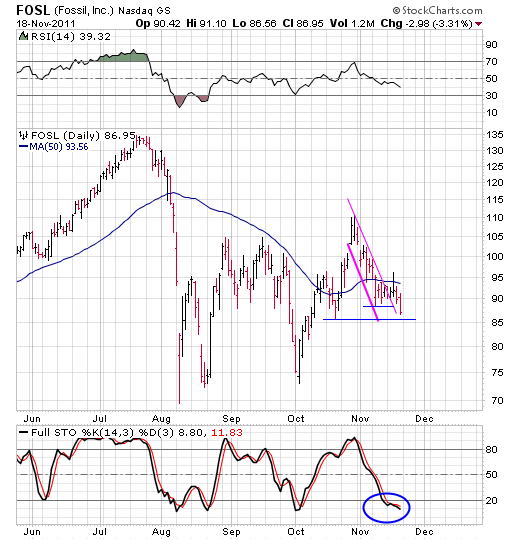
11-20 Not good not bad, I’d expect the lower blue line to be tagged on Monday. That is unless we get the squeeze the shorts with a 9 stocks up to every 1 down day up day. That goes for everything.
==============================
FEATURED BUT NOT TRADE TRIGGERED BY US LIST
GLD
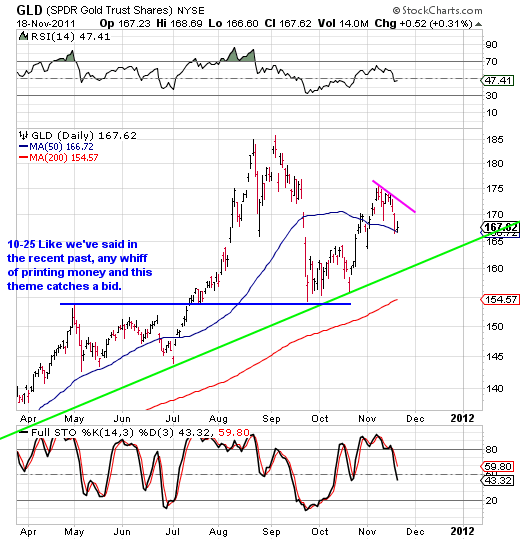
11-9 Gosh before you know it this issue will be testing its highs, which is resistance by the way.
OIH
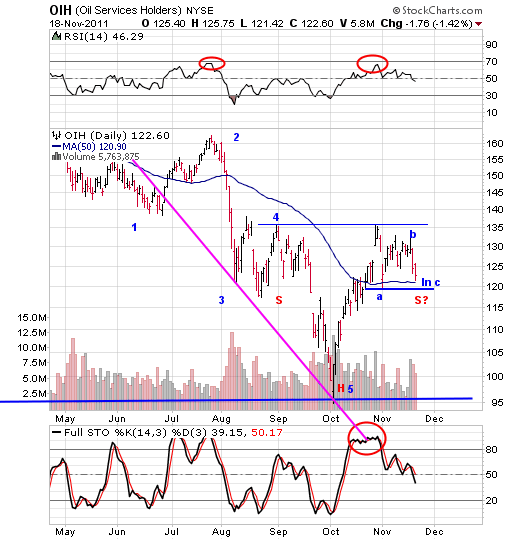
11-18 We’ll find out soon enough if the 50 day average ends up being support in here. Looking more like a right shoulder of a head and shoulders bottom more every day if you ask me.
==============================
CURRENT POSITIONS
"Let Your Stocks Tell You What To Do By The Action They Exhibit"
NOT YOUR EMOTIONS!
LONG SIDE POSITIONS
AMZN (We are long 75 shares of this at 204.56 as of 11-18-11)
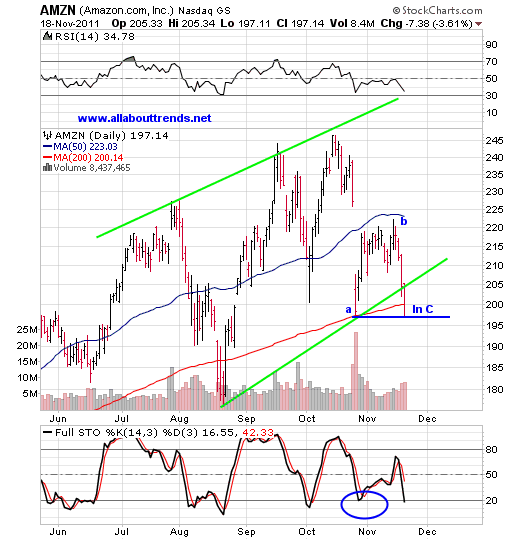
11-20 Like BIDU this name too is a go to name and prone to big moves in both directions. Mr. Market squeezes the shorts? This name is one they normally do it with. Say isnt that Kindle and books and everything else they have going on going to be a big deal this year as a go to place for gifts? Isn’t Cyber Monday a week away?
11-18 We nibbled on some of this right on the green trend channel support and here we are tagging a prior low and the 50 day average zone.
DECK (We are long 100 shares of this at 102.67 as of 11-17-11)
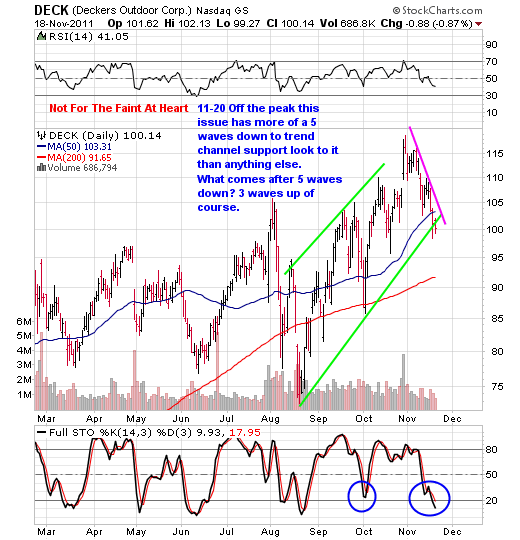
11-17 We did some nibbling on weakness in the face of fear at trend channel support just like we always do. Now? We sweat it out . So what IF (not saying its going to not saying it isn’t as I have no clue and neither does anyone else) this issue went down to the 200 day average as the markets tag the 50 day support level? Well we’d be down about 11 points or around the 10% mark. IF that were to happen should we stop out knowing its a support zone just because we’d be down 10%? or 1/2% of one percent impact to the overall portfolio? Nope.
RAX (We are long 250 shares of this at 42.54 as of 11-15-11)
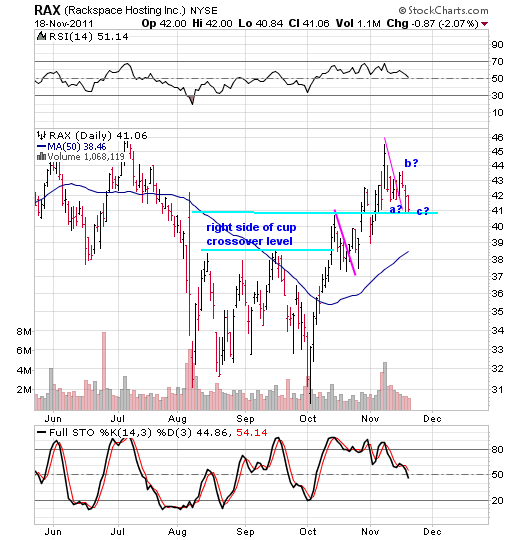
11-20 Recently we’ve touched upon using the 50 day as a guide. A point we want to make with this issue is that it could come down to the 50 day average and you know what? Its uptrend would still be intact.
BIDU (We are long 100 shares of this at 136.25 as of 11-11-11)
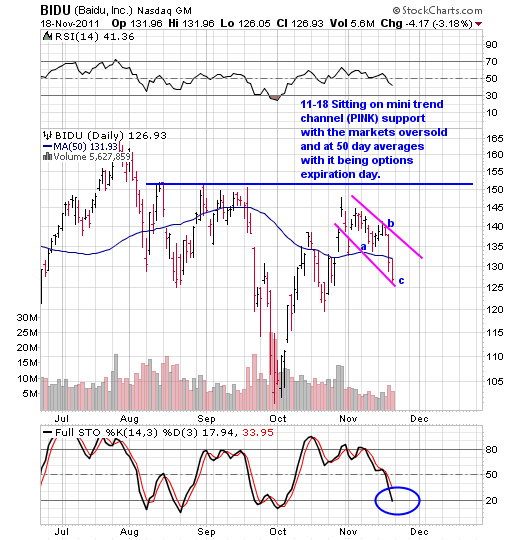
11-20 Little different animal vs the top names on the long side watch list but nonetheless, oversold and sporting an ABC. This is a go to name when markets ramp up. Heck even when we see the morning futures up only a few points this name is almost always up.
VHC (We are long 300 shares of this at 21.64 as of 11-11-11)
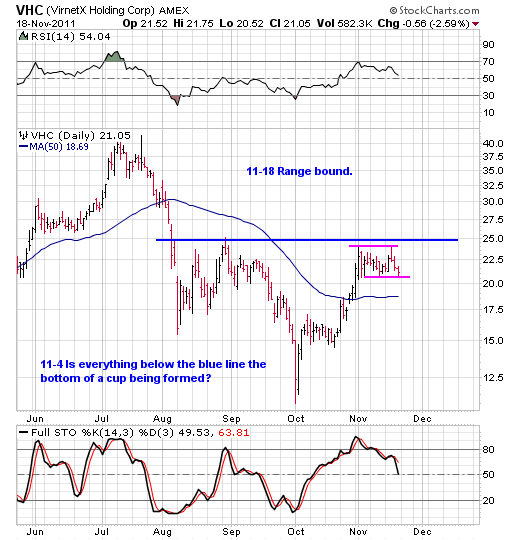
11-18 Going range bound here.
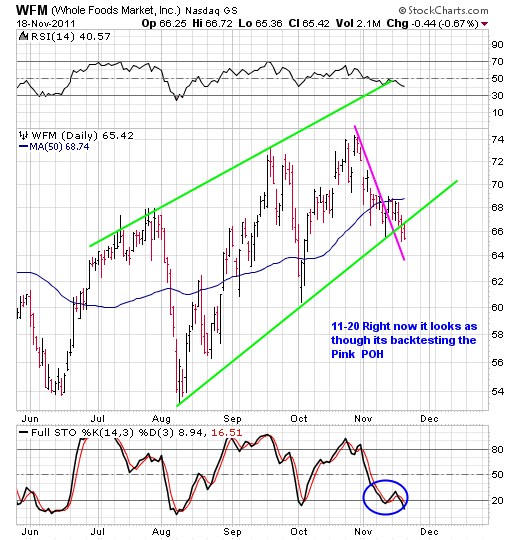
WFM (We are long 150 shares of this at 66.48 as of 11-10-11)
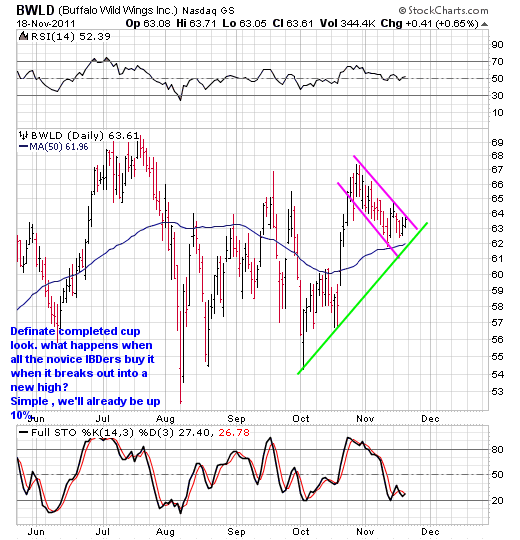
BWLD (We are long 125 shares of this at 64.13 as of 11-4-11)
(We are long 75 shares of this at 62.33 as of 11-10-11)
AAPL (We are long 25 shares of this at 398.56 as of 11-1-11)
(We are long 25 shares of this at 391.78 as of 11-10-11)
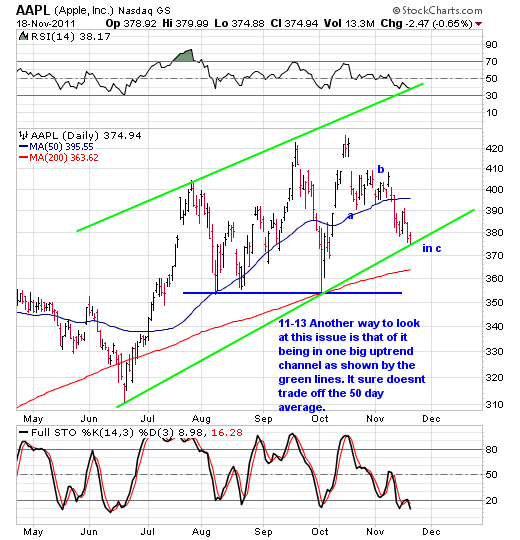
11-13 Recently we saw a few blurbs about how this issue is totally damaged because its below the 50 day. We get that on the surface HOWEVER look at the overall trend of this stock. It doesn’t trade off the 50 day, it trades off of a big green trend channel.
11-10 So lets play "What If" . What if this issue goes to the green trendline? Well first off its a support level. So would we want to stop out there? Knowing its a support level? And if it were to blow thru there and head to the 200 day average at 262 would we want to stop out there? Knowing its even more major support?
What impact would that have to the total value of our portfolio IF (not saying its going to not saying its not as I don’t know neither does anyone else) it went to the 200 day?. Let’s see we own 50 shares at 395.17 and this issue makes up 11% of our total portfolio. So IF it were to go to 362.00? we’d be down on the position 8.3% on its own. But what about the total impact to our overall portfolio? 9/10ths of one stinking percent!
On top of that? IF we would go there and stop out (which we wouldn’t do because its only a moment in time subject to the next moment in time) it would be a 1658.00 dollar loss. know what? We are up 3300.00+ for the month. So now how much damage would that be to us.
By using trade size risk management it really allows us to never really get flustered or in trouble. This allows us to always stay centered and objective because it really doesn’t mess with our most important asset which is our state of mind. Folks use this conversation as an example for yourself to think things forward and thru. It really helps calm the mind.
MAKO (We are long 100 shares of this at 37.37 as of 11-1-11)
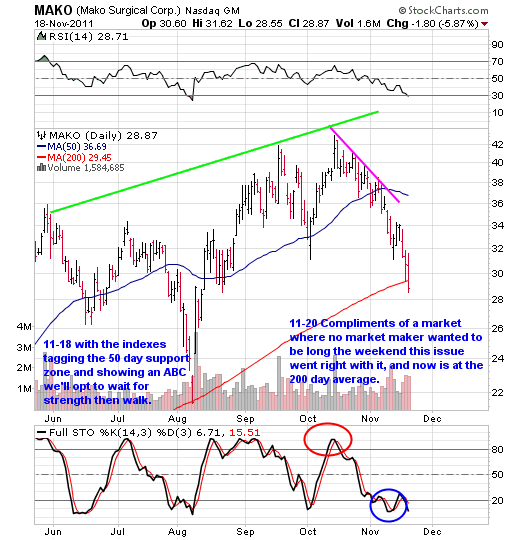
11-17 We’re really starting to hate this stock. We were ok with the retest of lows yesterday as that’s how double bottoms are made. But it’s a bit iffy here. As my friend said to me once; Want to see a stock take off to the upside? Just sell it and watch it take off without you. We’re tempted to pay the market gods with this one. Seriously though? It’s 100 shares and we’re just going to sit it out for a bit more of in-flight turbulence.
11-20 ESPECIALLY with all the positive indicator structure the indexes are sporting.
SHORT SIDE
NONE