Courtesy of Lee Adler of the Wall Street Examiner
This is an update of the Employment Charts page.
Initial Claims Charts
Updated May 8, 2012
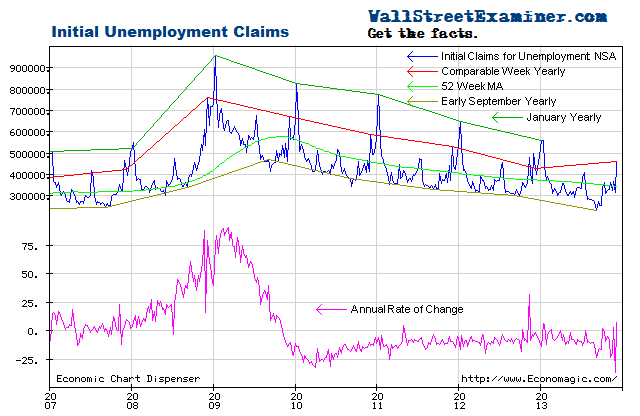
Actual, not seasonally manipulated, weekly initial unemployment claims, while volatile week to week, have continued to decrease at a relatively constant rate over time since mid 2010.
In the week ended May 5, actual claims rose by 8,900 including an estimate of 4,000 for the usual weekly upward revision due to incomplete state counts at the time of the advance release (current week) to the final data released the following week . This was worse than the week ended May 7, 2011, when claims fell by 18,000. However, over a two week span this year showed a decline of 28,000 versus an increase of 9800 in the same 2 weeks in 2011. The year to year decline was 13.9% which remains strong. Total claims in the current week were 342,000 versus 398,000 in the same week last year. While this is a good indication that fewer people are losing jobs, it does not tell us how many are finding work.
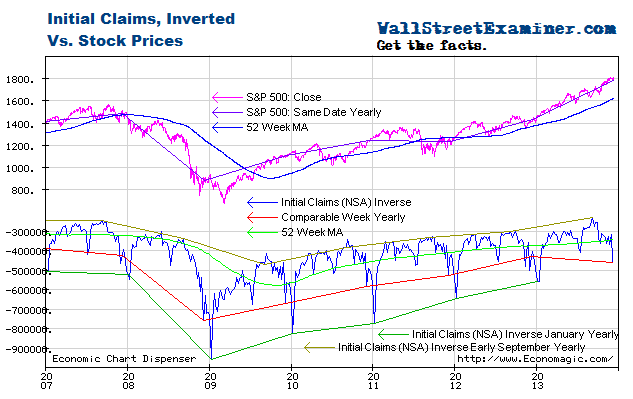
Plotted on an inverse scale, the correlation with stock prices is strong. Both are driven by the Fed’s operations with Primary Dealers as covered weekly in the Professional Edition Fed Report.
As the number of workers eligible for unemployment compensation has trended upward slightly since 2009, the percentage of workers filing first time claims has continued to decline.
The chart below gives a longer term perspective. We can see the trend improving but still above the bubble years with its 10 million or so fake jobs taking orders for new and unneeded condos and houses, building them, and taking and processing mortgage applications. This however does not account for the thousands of mortgage industry executives and Wall Street bankers who should be in jail but who still have jobs, and still bribe politicians.
This is a picture of reality versus the the Impressionist art of seasonal adjustments. Sometimes it represents reality to some degree, and sometimes it doesn’t. If you are following that data, at any given time you have no way of knowing which it is. One thing is certain. It ain’t photo-realism. There are ways to measure trends using actual data. One way is shown on this chart, which is to show the year to year line as of the current and corresponding date. Another is to view the annual rate of change as shown in the first chart above.
Enter your thoughts in the Comment Form at bottom of page. No registration necessary.
Federal Withholding Taxes
Updated May 8, 2012
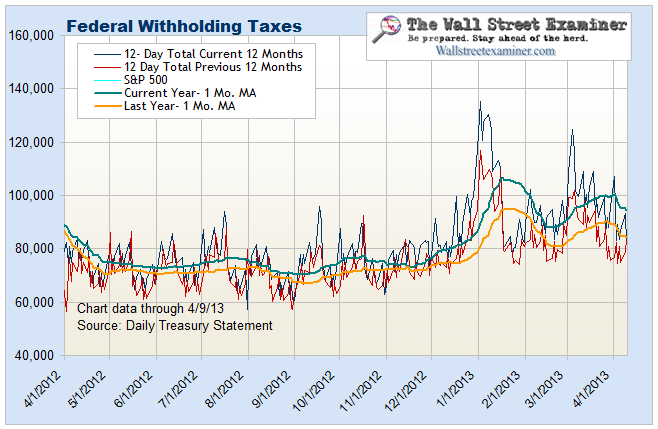
This chart compares current withholding tax collections with last year on the same date. This year has been running ahead of last year in nominal terms.
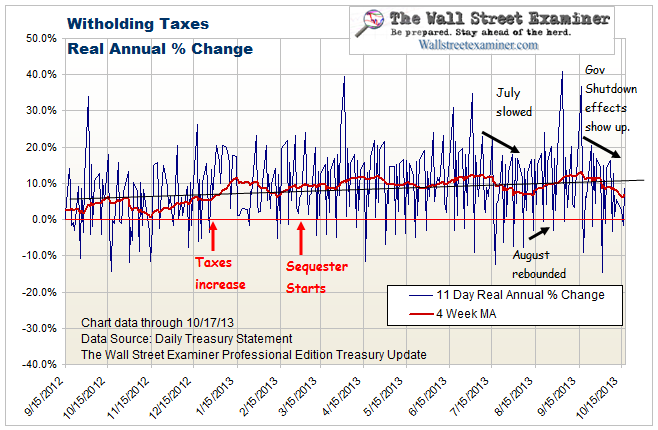
This chart looks at the year to year change in withholding in real terms, adjusted by the average weekly wage data from the BLS. On this score, following a bulge in March that was probably due to mutual fund withholding for capital gains distributions, the comparison is back to flat which does not bode well for employment. These 2 charts are updated and analyzed weekly in the Professional Edition Treasury update in conjunction with their implications for employment, and in particular the Federal deficit and Treasury supply.
Enter your thoughts in the Comment Form at bottom of page. No registration necessary.
Get regular updates the machinations of the Fed, Treasury, Primary Dealers and foreign central banks in the US market, in the Fed Report in the Professional Edition, Money Liquidity, and Real Estate Package. Click this link to try WSE's Professional Edition risk free for 30 days!
Copyright © 2012 The Wall Street Examiner. All Rights Reserved. The above may be reposted with attribution and a prominent link to the Wall Street Examiner.


