

Courtesy of Mish.
A few charts from the New York Fed Quarterly Report on Household Debt and Credit will help put into perspective the deflationary forces facing the Fed.
Household Debt and Credit Developments in 2012 Q3
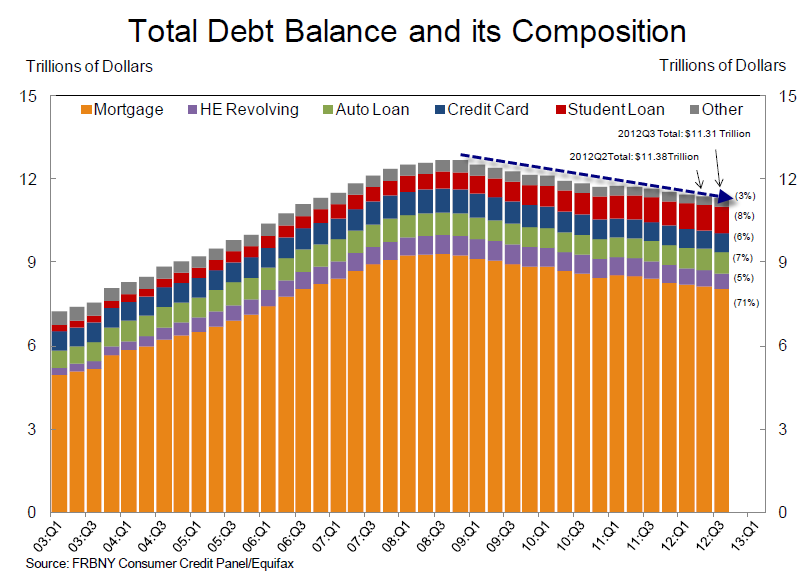
Aggregate consumer debt fell again in the third quarter, by $74 billion, continuing the nearly four-year downward trend in household debt. As of September 30, 2012, total consumer indebtedness was $11.31 trillion, 0.7% lower than its level in the second quarter of 2012 and down $1.37 trillion from the 2008 Q3 peak.
Mortgages, the largest component of household debt, continue to drive the decline in overall indebtedness. Mortgage balances shown on consumer credit reports continued to drop, and now stand at $8.03 trillion, a 1.5% decrease from the level in 2012 Q2.
Home equity lines of credit (HELOC) balances dropped by $16 billion (2.7%).
Non-mortgage household debt balances jumped by 2.3% in the third quarter to $2.7 trillion, boosted by increases of $18 billion in auto loans, $42 billion in student loans, and $2 billion in credit card balances.
Total Debt
click on any chart for sharper image
The deleveraging (deflationary) trend in consumer debt is unmistakable.
Number of Loans
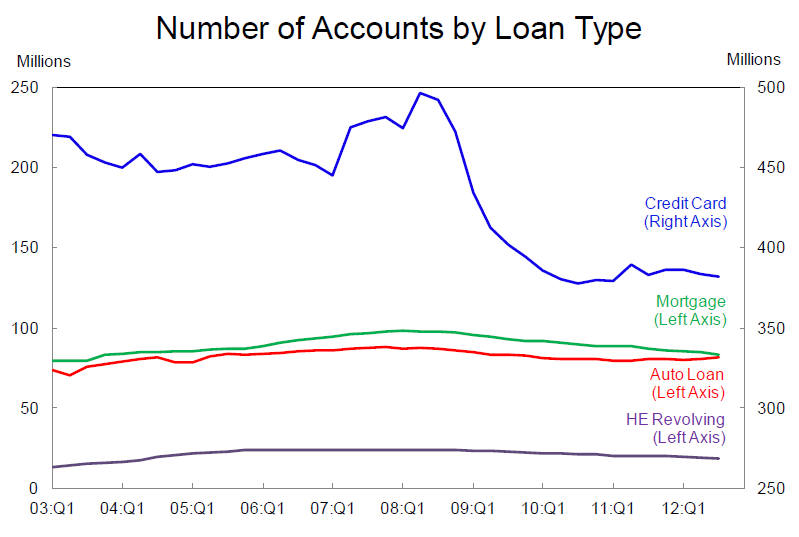
There is certainly no jump in the demand for credit card, mortgage, auto, or home equity loans….