

Courtesy of Mish.
Jed Graham at Investor’s Business Daily has an interesting chart showing Wage Recession Hits 5 Years; Worse Than Jobs Drought. I can show it’s even worse, but first let’s consider a chart and commentary by Graham.
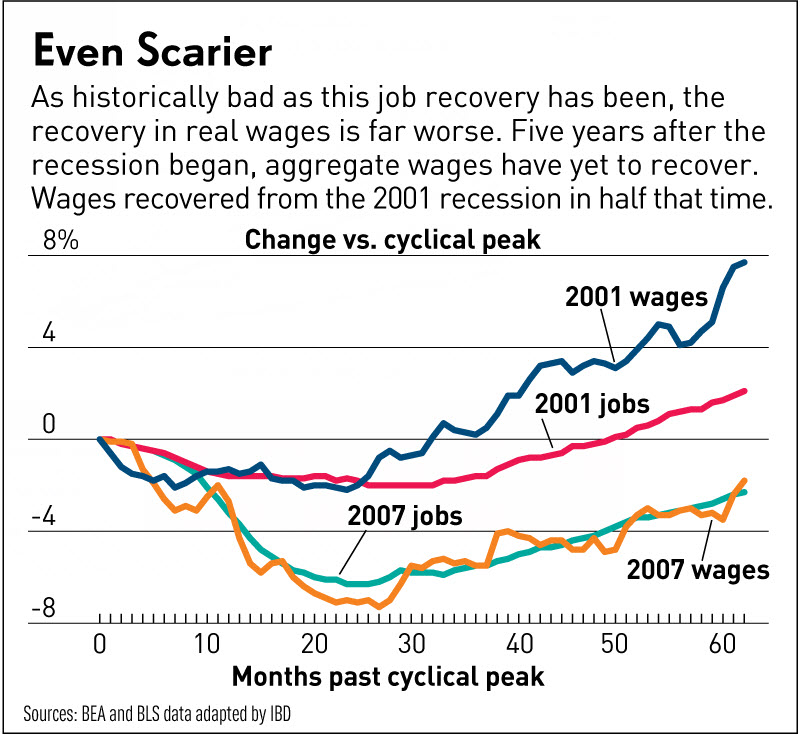
As bad as the current job recovery has been — and it’s by far the weakest since World War II — the recovery in wages has been far worse.
Five years after the recession began in December 2007, total wages in the economy have yet to fully recover in real terms, Commerce Department data show. In other words, the wage recession continues.
click on chart for sharper image
By comparison, the longest previous post-war wage recession, which began with the 2001 downturn, was over in 2-1/2 years, even though that jobs recession lasted four years.
In recoveries past, wage recessions have ended long before payrolls hit new highs. But in the current expansion, wages and employment are on the same slow track to recovery. Both remain about 2% below their old peaks.
Real Disposable Income
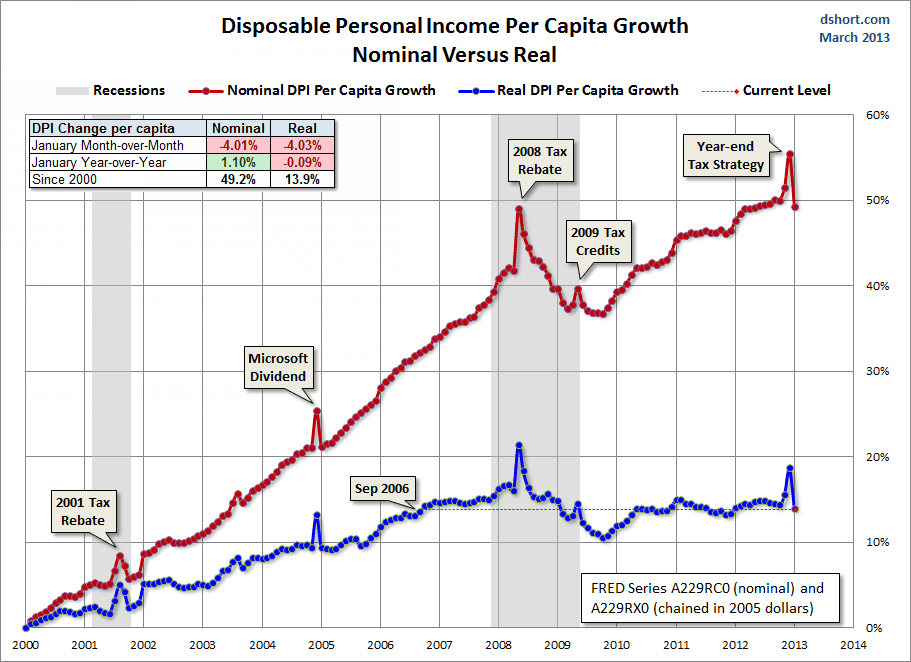
Instead of looking at wages, let’s consider real disposable income as a measure of the “wage recession”. Here is a chart from Doug Short at Advisor Perspectives on Nominal vs. Real Income.
Real Disposal Personal Income Per Capita
click on any chart for sharper image
That chart shows an income recession for six years. I suggest the wage and income recession is even longer if one looks a breakdown of median income….