

Courtesy of Mish.
Here are a few demographic-related charts of the workforce, civilian non-institutional population, and jobs, by age-group, from reader Tim Wallace.
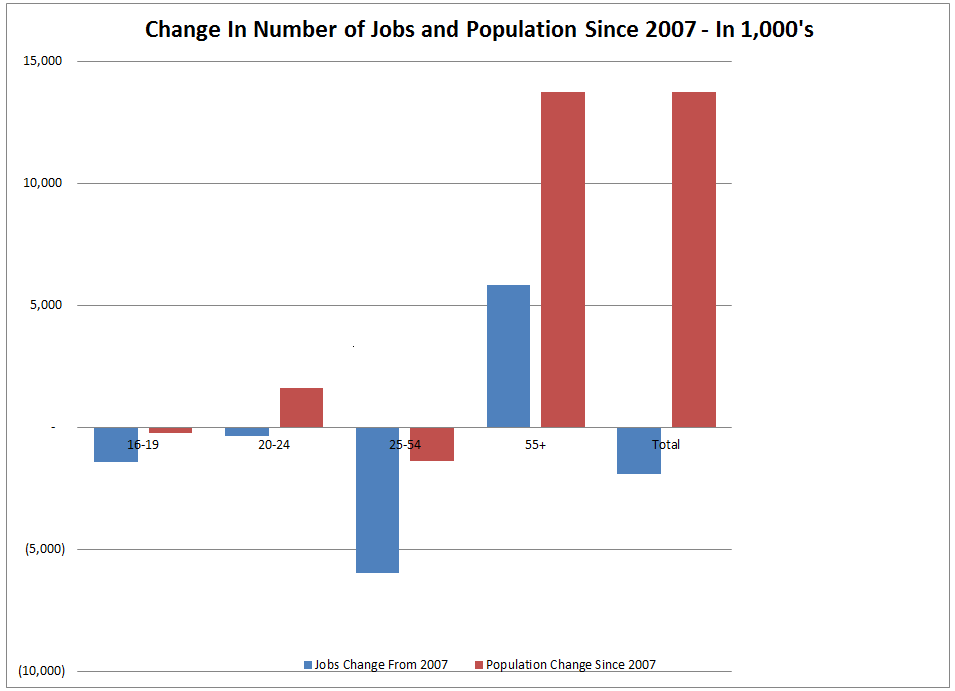
Change in the Number of Jobs Since 1970
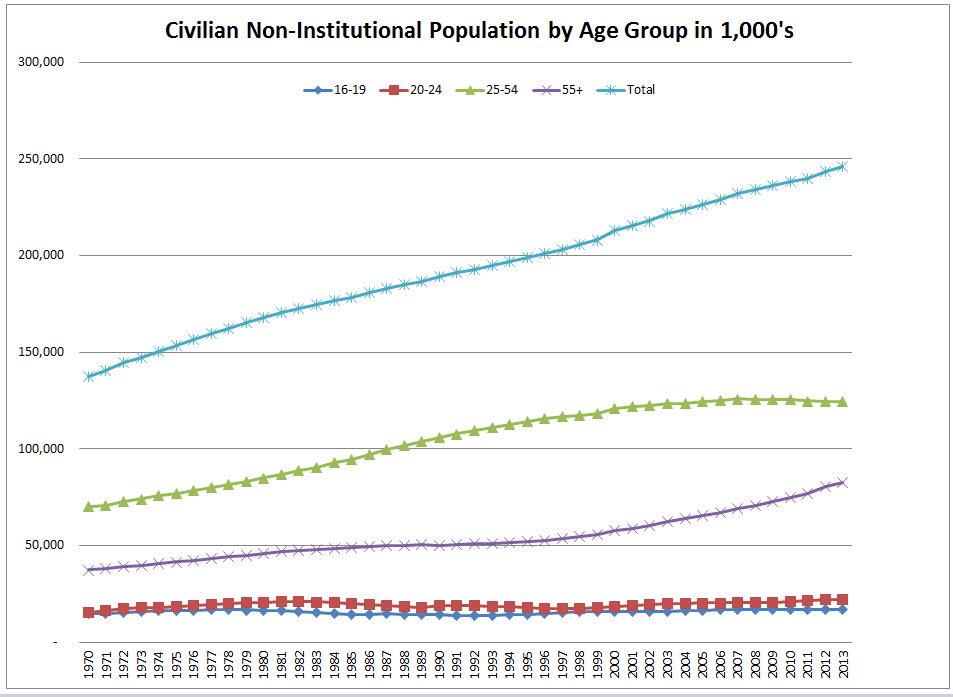
Civilian Non-Institution Population Since 1970
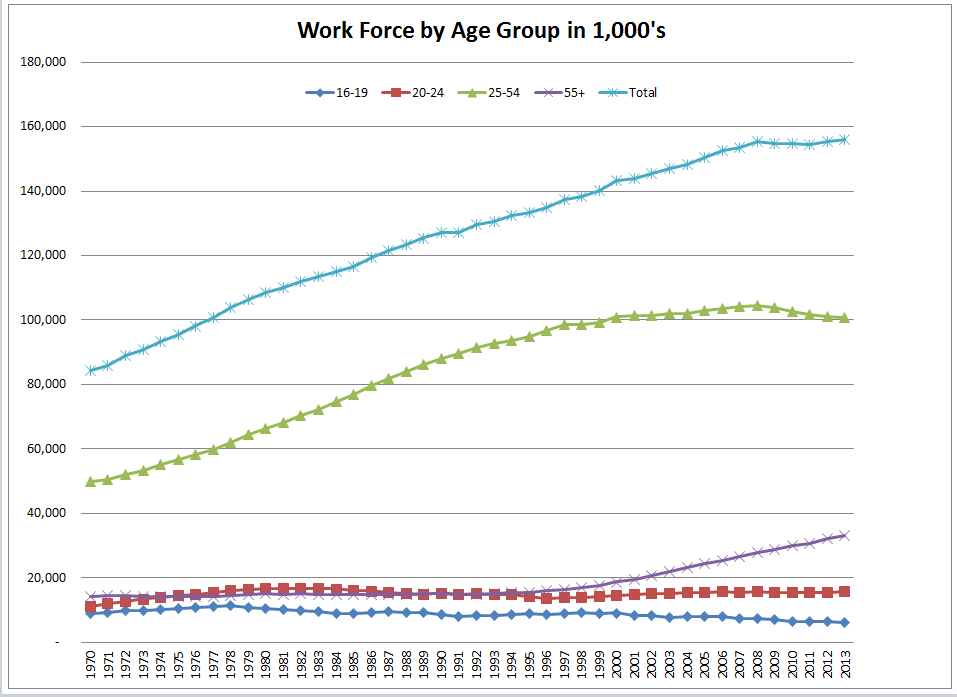
Workforce Since 1970
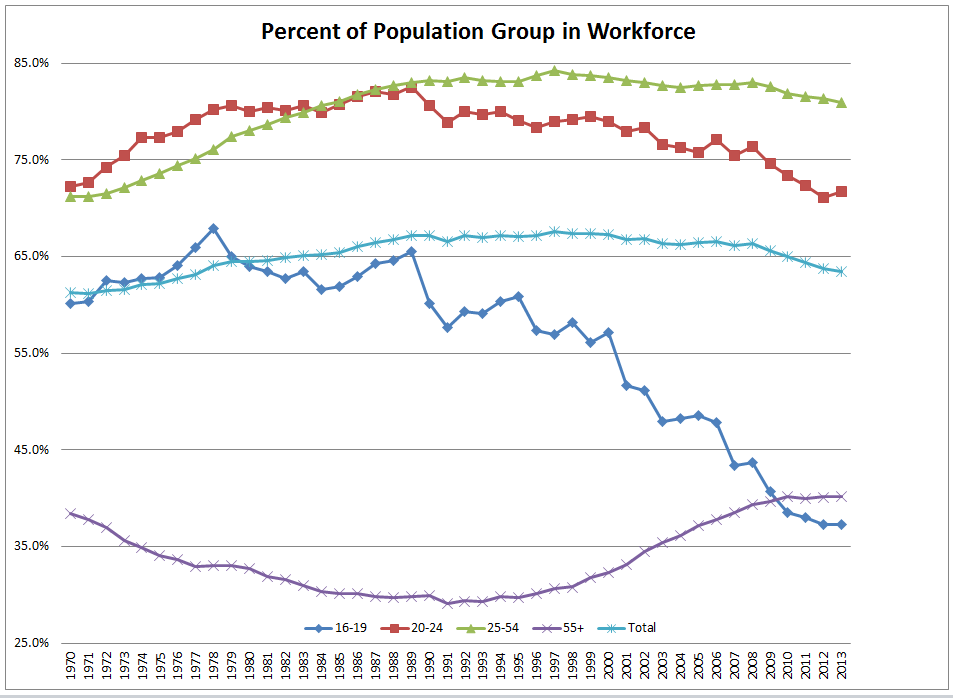
Percent of Population in Workforce Since 1970
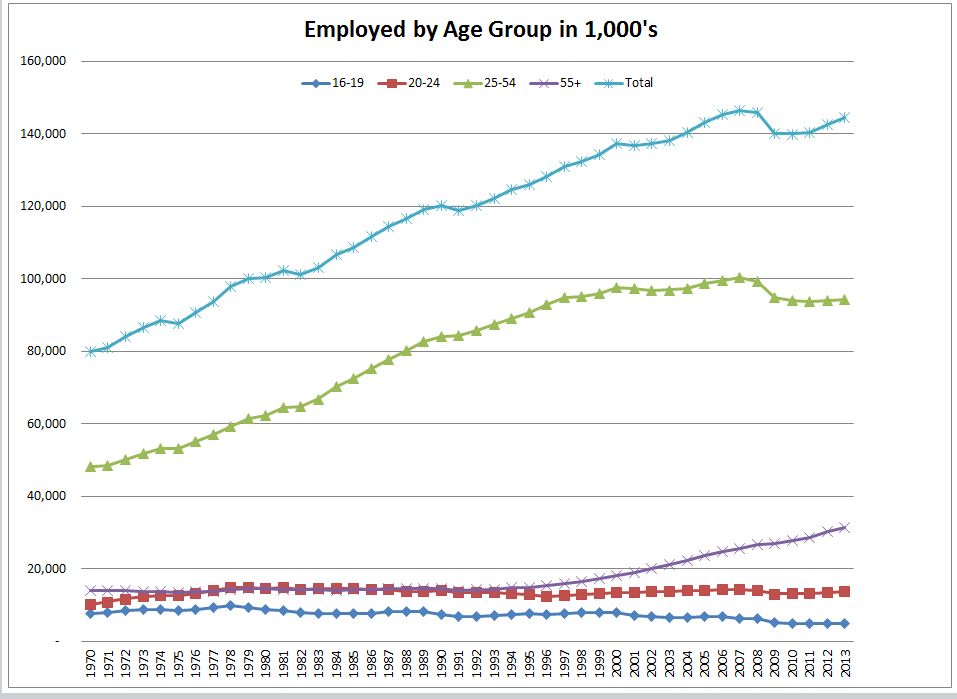
Number in Age Group Employed
…