

Courtesy of Mish.
Last week I received an excellent article from Variant Perception on “Market Tops”, and have permission to excerpt some of it.
Here is a link to the summary page of Understanding Market Tops. What follows are a few snips from the full report.
Framework for Understanding Tops
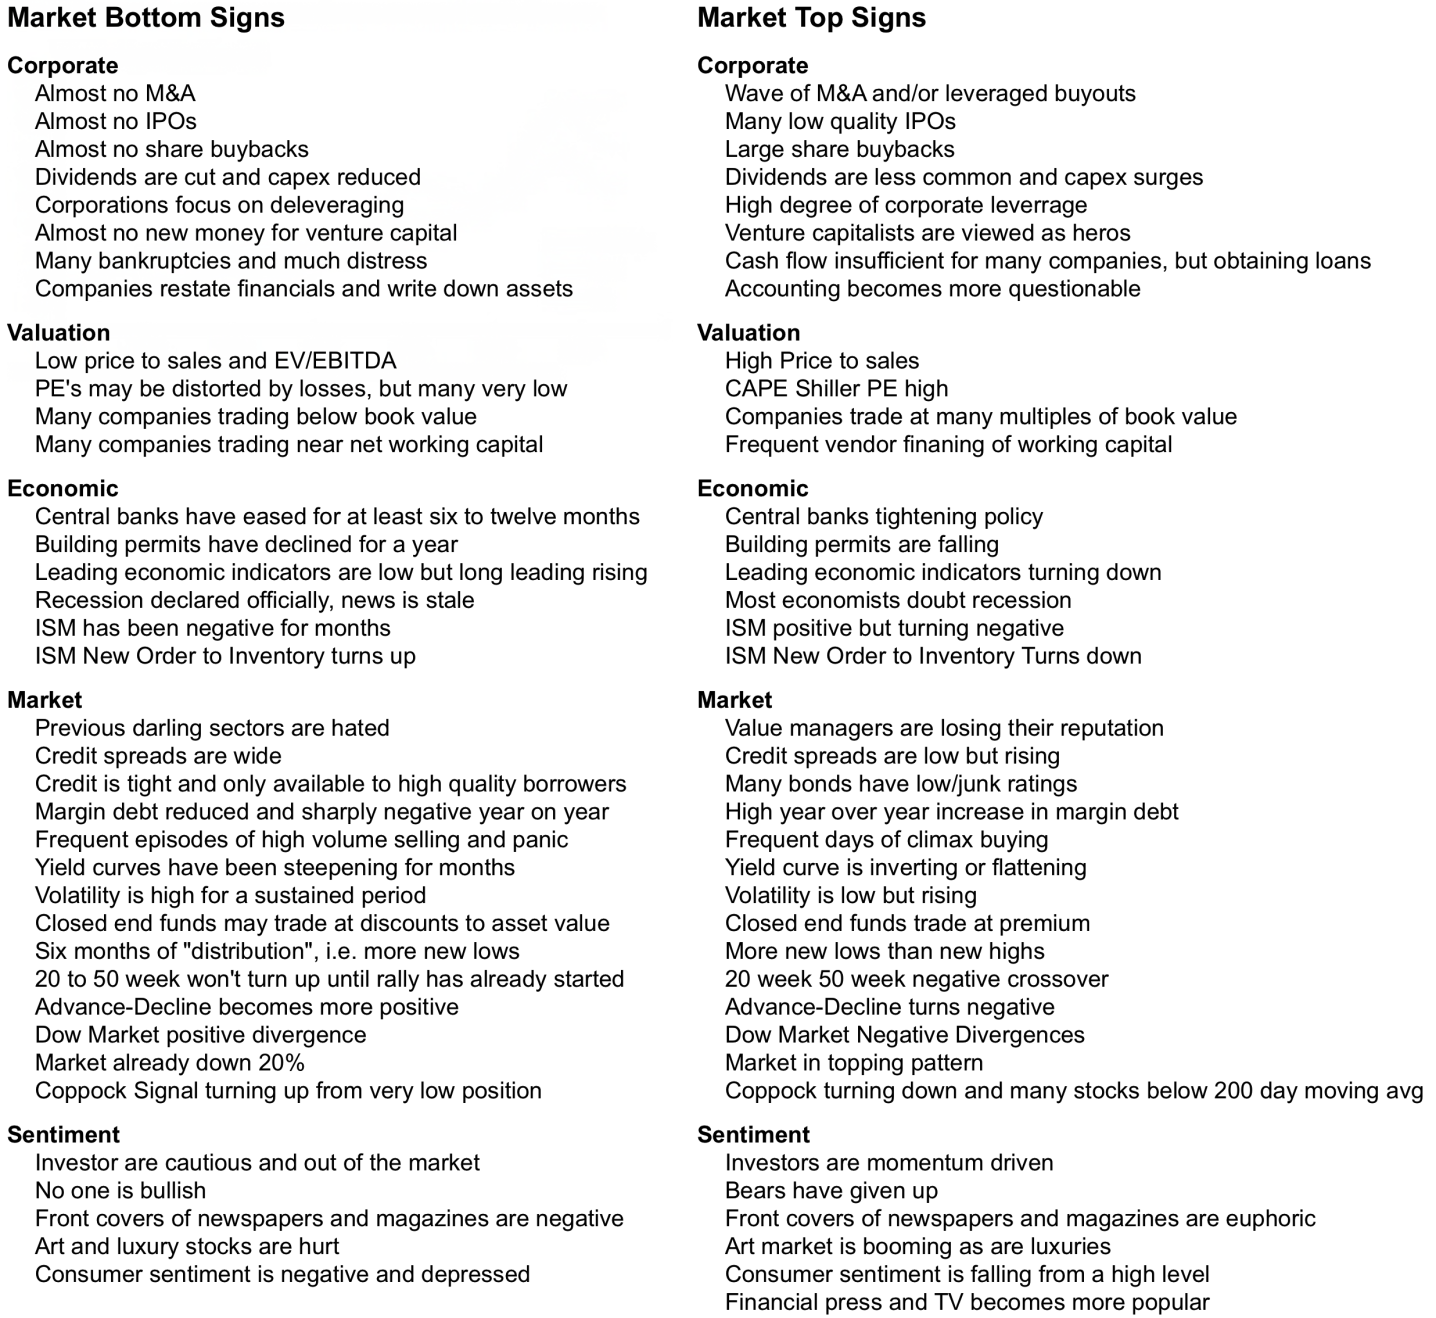
In the following table, we summarize the signs of market bottoms and tops.
The signs can be divided into the following categories: corporate, valuation, economic, market and sentiment. Clearly many signs of a top are in place, but there are many characteristics that are currently missing. In the coming pages we will look at each category separately.
click on any chart for sharper image
Today the market shows many of the elements that are present near market tops. In particular, sentiment is extremely bullish, investors are long and leveraged, and valuations are extended on a wide variety of measures. However, leading economic indicators are still not negative, and so far breadth and technicals have not deteriorated. The medium-term stock market returns are likely to be negative due to excessive valuation, but there is no imminent sign of a medium-term market top.
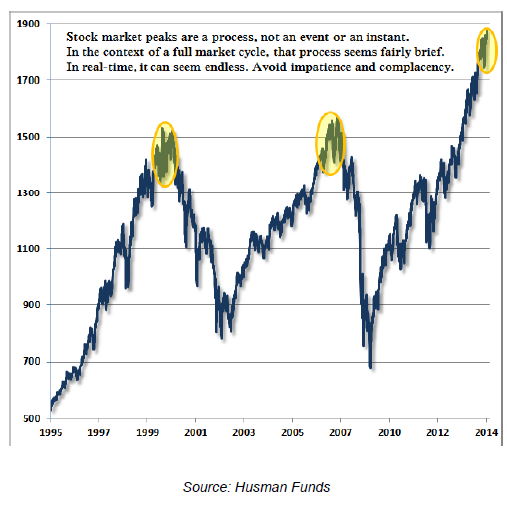
Tops are a process, not a single event. They tend to last a long period of time, and markets whipsaw traders and disappoint bears and short sellers. For example, many signs of a market top were clearly visible in late 1998, but it was not until the end of 2000 that most major market indices started to collapse. Likewise, many elements of a market top were evident in late 2006, but markets didn’t begin to collapse until very early 2008.
CORPORATE ACTIVITY: WE’RE SEEING TYPICAL SIGNS OF MARKET TOPS
CEOs are bad capital allocators of corporate cash and provide contrarian clues, but insiders are much better at providing insight with what they do with their own cash….