

Courtesy of Mish.
In light of the enormous discrepancy between the Household Survey and the Establishment Survey in last Friday’s jobs report, I thought it might be worthwhile to revisit the discrepancy between Gallup and the BLS that I have talked about before.
Recall that last Friday the Establishment survey showed a net gain in jobs of 288,000 while the household survey showed a net loss in employment of 73,000.
Those are seasonally adjusted numbers. For details please see Nonfarm Payrolls +288,000, Unemployment Rate Drops to 6.3%; Household Survey Employment -73,000, Labor Force -806,000,
Seasonally Adjusted Numbers
- Nonfarm Payroll: +288,000 – Establishment Survey
- Employment: -73,000 – Household Survey
- Unemployment: -733,000 – Household Survey
- Involuntary Part-Time Work: +54,000 – Household Survey
- Voluntary Part-Time Work: -330,000 – Household Survey
- Baseline Unemployment Rate: -0.4 at 6.3% – Household Survey
- U-6 unemployment: -0.4 to 12.3% – Household Survey
- Civilian Non-institutional Population: +181,000
- Civilian Labor Force: -806,000 – Household Survey
- Not in Labor Force: +988,000 – Household Survey
- Participation Rate: +0.2 at 62.8 – Household Survey
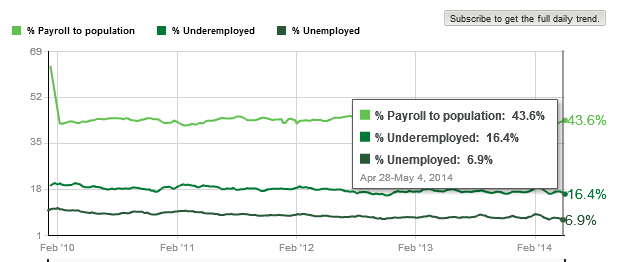
Gallup Unemployment Rate
The weekly Gallup Employment Poll shows the percentage of unemployed is 6.9% and the percentage of underemployed is 16.4%.
Gallup explains “Weekly results reflect 30-day rolling averages ending each Sunday, based on telephone interviews with approximately 30,000 adults. Because results are not seasonally adjusted, they are not directly comparable to numbers reported by the U.S. Bureau of Labor Statistics.“
Actually, results are directly comparable if Gallup would simply use the BLS non-adjusted data. Here are the comparable charts.
Gallup Non-Adjusted Unemployment Rate
BLS Non-Adjusted Unemployment Rate…