

Courtesy of Mish.
Recovery talk goes on and on. Assuming there is a genuine recovery as opposed to a financial recovery, where would one most likely find evidence?
I propose evidence should be apparent in those out of school, yet not retired. More specifically, we should see evidence in the age 25-54 demographic.
Let’s take a look.
Civilian Labor Force Participation Rate 1990-Present
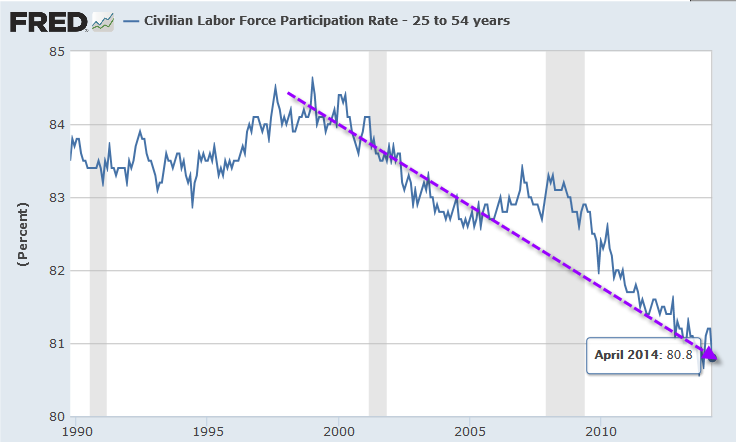
The participation rate is the percentage of people who are either employed or actively seeking work.
Where is the recovery?
Some might accuse me of cherry picking a timeframe on the above chart. OK. Here is a longer-term chart.
Civilian Labor Force Participation Rate 1950-Present

Women entered the workforce en masse in the 1960s to 1990s. Leveling off is understandable, but why the decline?
…