

Courtesy of Mish.
I have two sets of interesting charts from reader Tim Wallace on labor force, population, and employment.
This post shows the first set, a comparison of April 2008 to April 2014. Click on any chart to see a sharper image.
Age 16-24 Stats
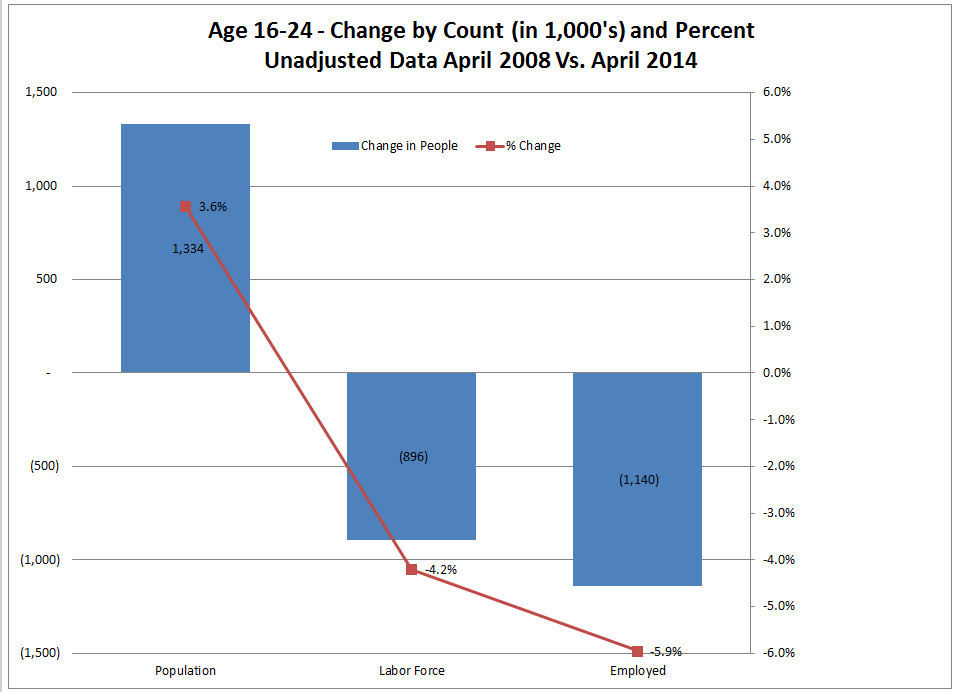
Since April 2008, the population in age group 16-24 rose by 3.6% but the labor force declined by 4.2%, and employment fell by 5.9%.
Age 25-54 Stats

Since April 2008, the population in age group 25-54 declined 0.8%, but the labor force declined 3.6%, and employment declined 4.6%.
Age 55-64 Stats
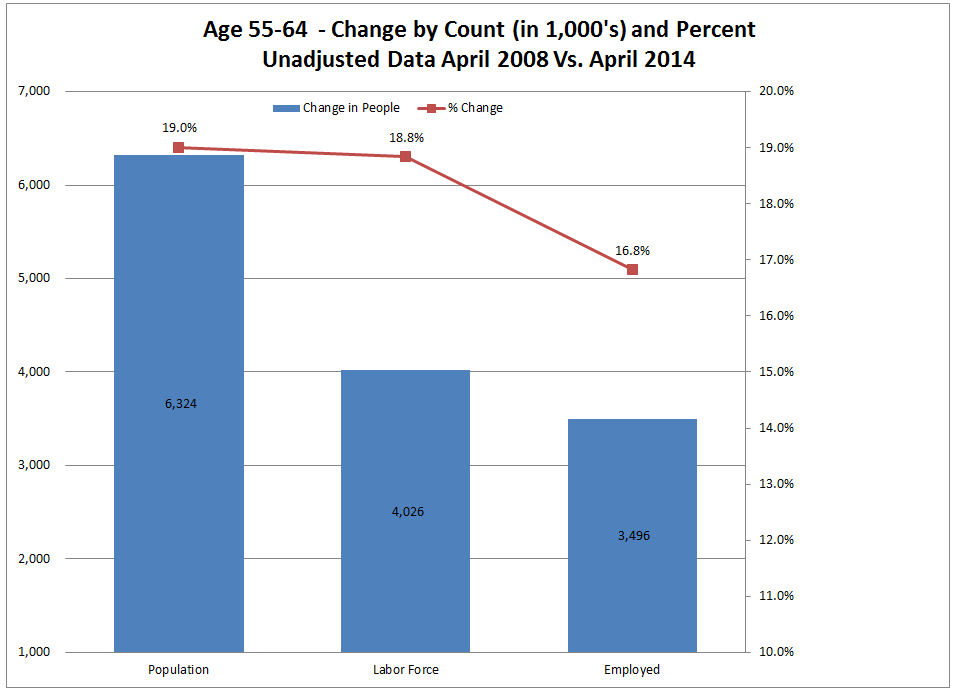
There are significant surges in Population, Labor Force and Employed in the 55-64 age group. Most employment growth is here. However, employment did not come close to keeping up with growth in population.
…