

Courtesy of Mish.
Wages have seemingly been on a tear since 1965 having risen from $2.5 per hour in February of 1964 to $20.5 per hour in May of 2014. A couple charts will show what I mean.
Average Hourly Earnings of Production and NonSupervisory Private Employees

click on any chart for sharper image
Average Hourly Earnings of All Private Employees
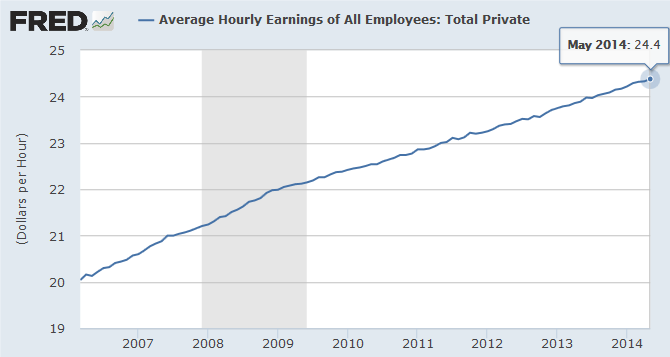
Data for all private employees only goes back to March of 2006.
Real Earnings
On Monday, a BLS Real Earnings report showed:
- Real average hourly earnings for all private employees fell 0.2 percent from April to May. This result stems from a 0.2 percent increase in the average hourly earnings being more than offset by a 0.4 percent increase in the Consumer Price Index for All Urban Consumers (CPI-U).
- For all private employees, real average hourly earnings fell 0.1 percent, seasonally adjusted, from May 2013 to May 2014.
- Real average hourly earnings for production and nonsupervisory private employees fell 0.1 percent from April to May, seasonally adjusted. This result stems from a 0.1 percent increase in average hourly earnings being more than offset by a 0.3 percent increase in the Consumer Price Index for Urban Wage Earners and Clerical Workers (CPI-W).
- Real average hourly earnings for production and nonsupervisory private employees rose 0.3 percent, seasonally adjusted, from May 2013 to May 2014.
“Real” means adjusted for price inflation. The BLS uses CPI-U as the deflator for all private employees, and CPI-W as the deflator for production and nonsupervisory private employees.
Wages vs. Prices…