

 This is a big deal.
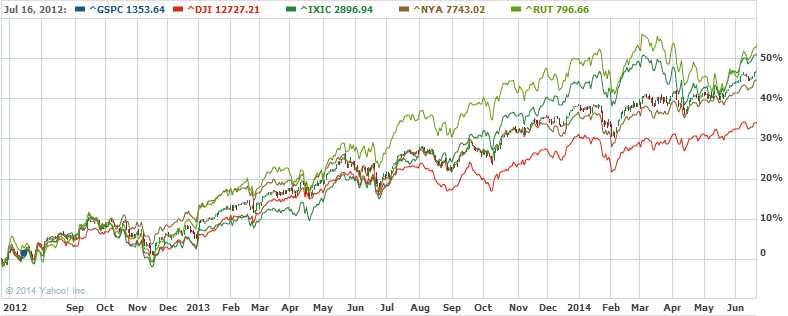
We haven't updated our Big Chart since mid 2012 but we've finally cleared the top of the NYSE's range and it's time for us to ratchet up our expectations for this rally.
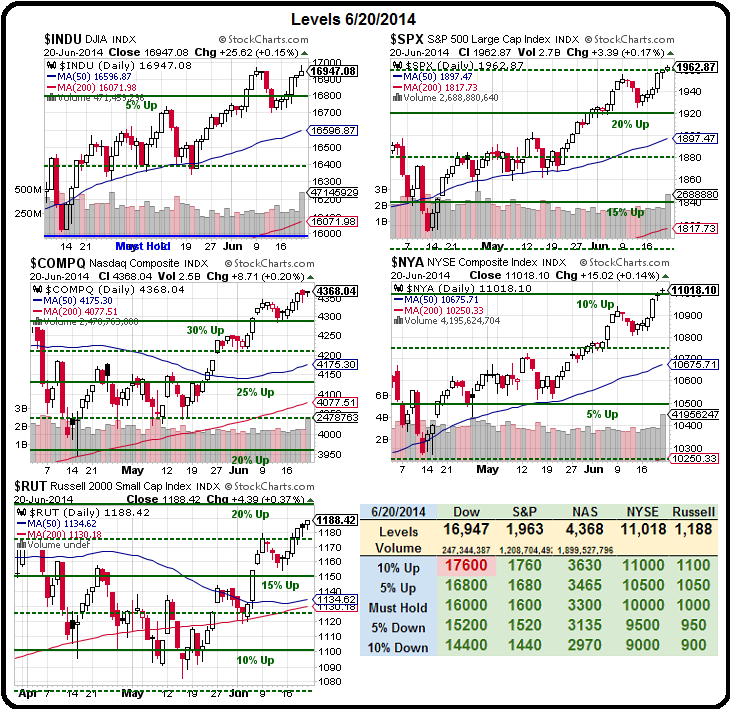
As you can see on our current Big Chart, our mid-point targets were 16,000 on the Dow, 1,600 on the S&P, 3,300 on the Nasdaq, 10,000 on the NYSE and 1,000 on the Russell.
As with all our 5% Rule™ ranges, we allow for 10% overshoots but, at this point, 4 of our 5 indexes have made it and now it's time to redraw our lines, adjusting for things like the Dollar, changes to the Index Components and volume consolidations we've seen in the past two years.
As you can see, we were right to be skeptical in 2012 and we ultimately had our 10% pullback but that then triggered QE3 from the Fed, which has since become QInfinity and they pretty much haven't let the market have a proper pullback since. We did have a quick dip this January but if you blinked – you missed that one and the Russell and Nasdaq faltered in March, but promises of more QE have them back on track now as well.
 The small correction we had last summer gives us a decent consolidation point 20-30% below our current levels, but those are the bottom of our Must Hold ranges. The question is, if this rally is real – what do we expect out of it? The easy answer is not much. Without the constant infusion of Fed funds, we'd never be this high in the first place. Of course, when I say Fed, I mean all Central Banks, as 60% of the S&P's revenue now comes from outside the US.
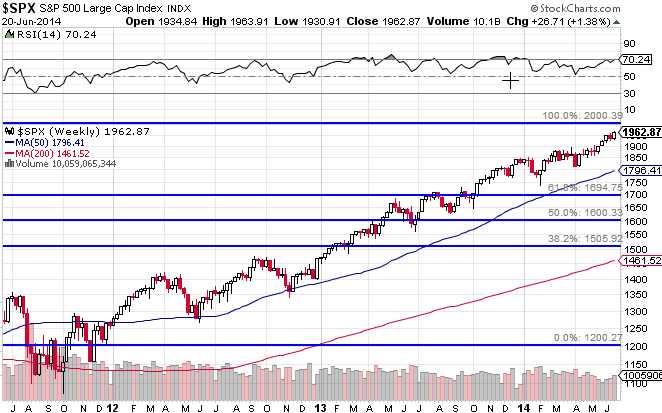
 As you can see from the Fibonacci view of the S&P above, the logical line to move our "Must Hold" level to on that index is 1,800 but 1,980 would already be 10% above 1,800 so it seems sort of silly to draw a line that's already so far behind. But 1,800, on the other hand is still the level the S&P MUST HOLD to keep us bullish – and that is the point of the Big Chart – to let us know which side of the trade to be on in our Long-Term Portfolios.
As the S&P crossed it's current 20% line, at 1,920, we cashed our out Long-Term Porfolio, which was outpacing the S&P with a 20% gain for the year. In the past two weeks, we've already added back 11 positions – as the pullback we expected never came and our Big Chart indicated the rally would contine – that's what it's there for!
 Perhaps the issue is that the Big Chart was designed for calmer markets and these 2-year, 50% moves that are resulting from artificial stimulus simply call for wider bands and wider fault tolerances. When the S&P first broke over 1,200 in 1998, it rocketed up to 1,560 (+30%) before a major pullback – and that pullback went all the way to 800! We tested 1,600 again in 2007, back to 800 in 2009 and now, on our 3rd attempt (and with A LOT of artificial stimulus), we've finally broken over the line and 30% over 1,600 is 2,080 – so let's call that our goaaaaaaaallllllllllllllllll.
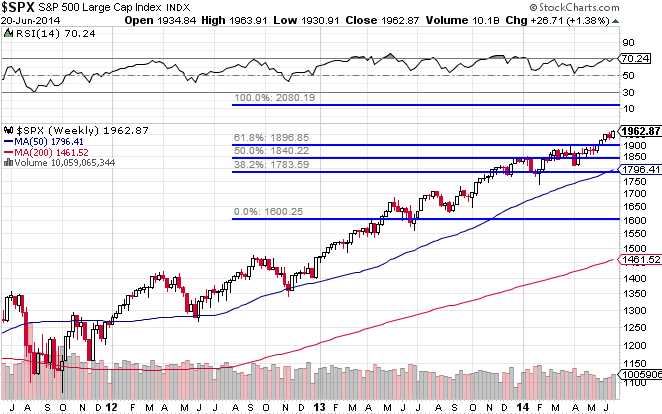
As you can see, adjusting our Fibonacci lines to a base at 1,600 shows the S&P following a fairly well-behaved pattern through those lines. Since our goal is going to be very bullish, it makes sense to move the "Must Hold" line to the middle of that range, which would be 1,840 and simply widen our expectations a bit. But, as I said, we also adjust for the Dollar and Component Changes so we're going to use 1,850 as our new Must Hold Line on the S&P and that will put the 5% up level at 1,942 and 5% down at 1,757:
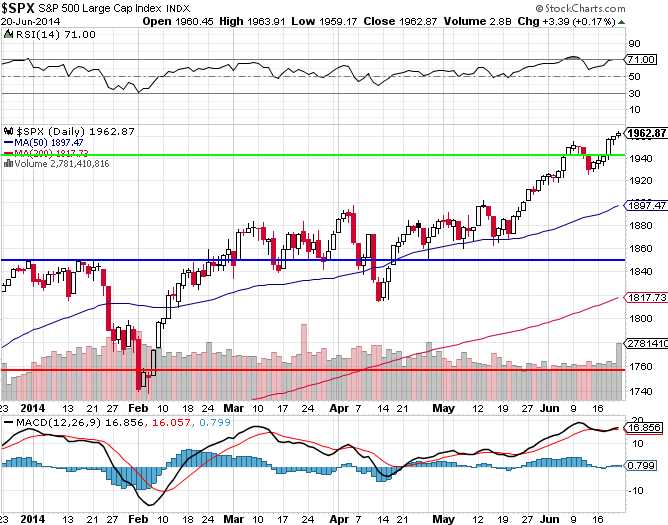
As you can see, we did get nice consolidation around the 1,850 line from March through May and it acted as good resistance in January, with a small correction back to the -5% line. Those are the attributes we expect from a Must Hold line – so 1,850 gets the job!
 The Dow is more complicated because they keep changing it. Since our last Big Chart update, KFT was replaced by UNH and AA, BAC and HPQ were replaced by GS, NKE and V. Since the Dow is price-weighted and since GS, NKE and V add up to $455 vs $64 on the components they replaced, the last 3 components came in with 7 TIMES more weighting than the stocks they replace.
The good news (from a charting perspective) is that none of them have done much since last September, when they were added, so they haven't thrown the Dow too far out of kilter. Also, keep in mind TA people don't take any of this into account and they chart the Dow as if nothing has ever changed – despite the fact that there were 7 other changes in the past 10 years alone. That means 1/3 of this index wasn't even in the index in 2004 – yet "TA Professionals" act as if nothing has changed!
 With the new components, our Dollar adjustments and taking into account that the Dow has been lagging our other indexes by a wide margin, we're going to give it a more aggressive Must Hold line at 16,600, which will make 18,260 the 10% line and our rally goal (20%) line way up at 19,920. Since the 5% Rule is not an exact science, however, and since we know the market has an affinity for whole numbers – we should probably use 20,000 as the goal and that makes -10% the 18,000 line and -20% the 16,000 line.
Now we have to apply some logic and consider whether or not the Dow can or SHOULD gain almost 20% from where it is now (16,947) and the quick answer is no. In other words, should IBM be $220? Should XOM be $125? Should WMT be $92? If not, then how they Hell would the Dow get to 20,000? So it's an unrealistic goal (for the next 12 months, at least) and that should keep us overall cautious (see our famous "tugboat" model) with the other indices.
 Realistically, that brings us right back to 16,000 as the Must Hold – but that's where the Must Hold line is now and, if that's the case, then we shouldn't be adjusting the Big Chart at all but, instead, preparing for a correction – because it's the other indexes that are wrong! Since we are TRYING to go with the bullish flow, however, we'll move the Must Hold up 10% to 17,600 (higher than the Dow is now) and, if the rally is real – they should be able to take it out in short order. If not, that red line will remind us that all is not entirely well.
 The Nasdaq is easy since the goaaaallll there has been 5,000 since 2000 and we're finally making a proper run. That's going to make 4,000 the new Must Hold line and we're already just under the 4,400 10% line – but it don't mean a thing until we take it out.
NYA 11,000 is what we've been waiting for to redraw the Big Chart but we only just made it last week so let's not get too excited unless it holds it. Therefore – you guessed it – 11,000 MUST HOLD in order for us to stay bullish! See how easy this stuff is. That's the origin of the term "Must Hold" and that's exactly how we use it – we find key levels to support a bullish premise and, as long as they hold, we can keep BUYBUYBUYing.
 Finally then, the Russell and that one has completely blown the doors off our 1,000 Must Hold line. Of course, it did that back in March as well and then fell over 10% in short order so this second attempt isn't going to impress us until they are over for a week. Still, 1,000 is clearly an inadequate Must Hold line and, in fact, the Russell Must hold 1,200 for us to really be bullish (ie. stop expecting a pullback) and 1,100 is what needs to hold on a pullback.
1,080 has been the bottom of the recent range and – guess what? – if we move the Must Hold line up to 1,200, then 1,080 becomes the -10% line, which is SUPPOSED to be the bottom of the range. Isn't it amazing how these things work out? Not really – our 5% Rule™ has been holding up since the dawn of computerized trading and only gets stronger every year as more and more trading is automated.
Soon, they won't need us at all to make the markets – just our money! Meanwhile, our official new Must Hold lines will be: Dow 17,600, S&P 1,850, Nasdaq 4,000, NYSE 11,000 and Russell 1,200. That means we need 3 of 5 of those to be green to stay bullish in our Long-Term Portfolios so we'll watch the Russell (1,188) and Dow (16,847) closely to make sure they get over and they NYSE (11,018) needs to stay over or we'll be looking for more downside protection.