

Courtesy of Mish.
In the wake of falling oil prices, tensions in Ukraine, and sanction madness that hurts both Russia and the Eurozone, the ruble has been on a huge slide.
Ruble Daily Chart

Since June the Ruble has slid from about 34 to the US dollar to 44.9 to the US dollar. That is a decline of 24 percent. A long-term chart shows an even bigger decline.
Ruble Weekly Chart
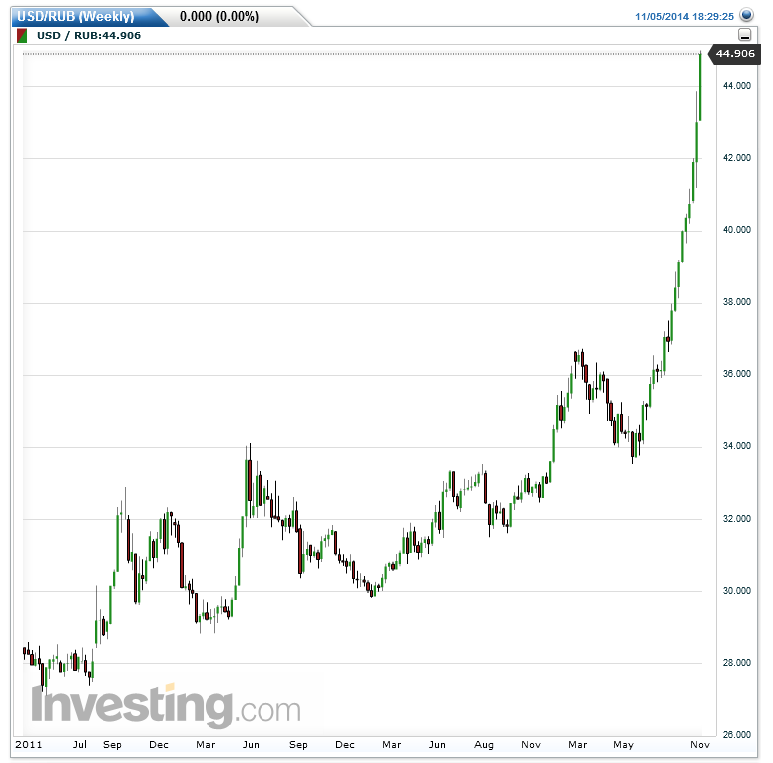
Since the beginning of 2011 the Ruble has gone from 28 to the US dollar to 44.9 to the US dollar. That's a decline of 37.6 percent.
Russia's Attempts to Stabilize the Ruble Fail
The decline has been pretty orderly until about June of this year. To halt recent decline, Russia hiked interest rates on October 31 to 9.5% from 8.5%.
As the first chart shows, that huge rate hike did not halt the slide.
Russia had also been intervening in the currency markets to the tune of about $2.5bn a day, but that's not a sustainable action.