

Courtesy of Mish.
A week ago Fed Governor Dudley announced “U.S. Economic Outlook Looks Brighter”. My response was Ring! Ring! Goes the Bell.
Today, Curve Watcher’s Anonymous offers a few charts that show the bond market ringing a bell in disbelief of Dudley.
Yield Curve as of November 28, 2014
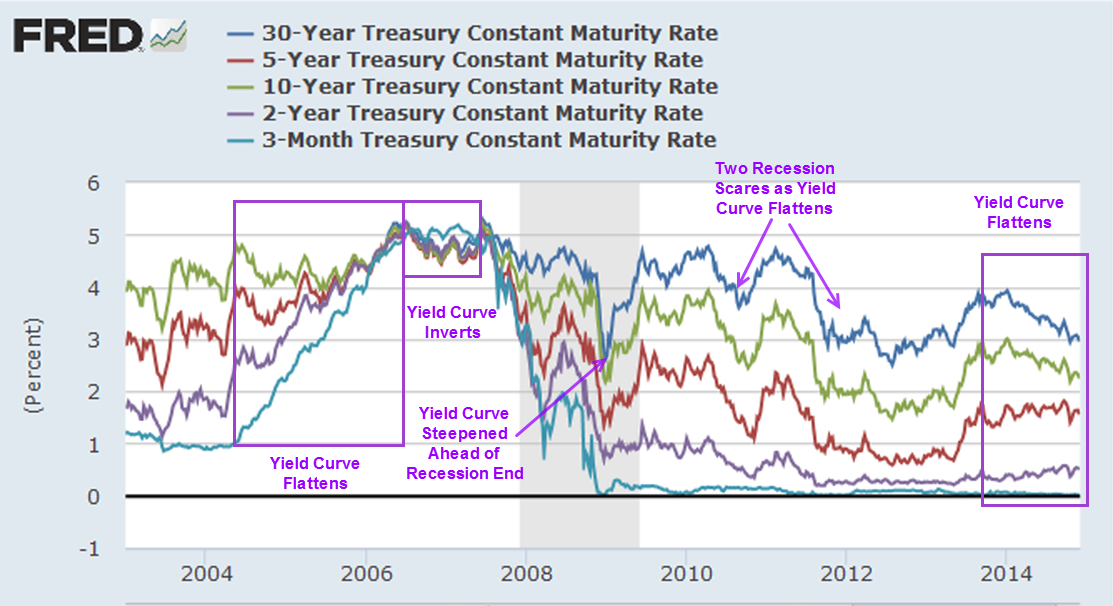
Curve Analysis
- The yield curve flattened, then inverted prior to the last recession.
- The yield curve steepened well ahead of the end of the recession.
- Since then, the yield curve has steepened twice and flattened twice.
What’s Next?
Starting at the beginning of 2014, short-term yields (2-year and 5-year) have risen while long-term (30-year and 10-year) have declined.
In a strengthening economy, yields on the long end of the curve typically rise faster than yields on the short end.
Those waiting for the typical recession indicator (an inverted yield curve where short-term bonds yield more than long-term bonds) may as well be waiting for Godot with the Fed holding 3-month rates near zero percent.
Nonetheless, expectations of a major Fed tightening cycle are pretty much the norm. If the Fed hikes (which I doubt), then I fully expect to see action similar to the first yield-curve flattening box in the above chart. If the Fed continues to hike, expect a quick inversion.
…