

Courtesy of Mish.
100% of economists predicted yields on the long end of the US treasury curve would rise in 2014. Instead, they dropped all year.
And just two weeks into January of 2015, the 30-year long bond made a new intraday record low of 2.39%, breaking the previous low of 2.44% on July 26, 2012.
Yield Curve as of 2015-01-14
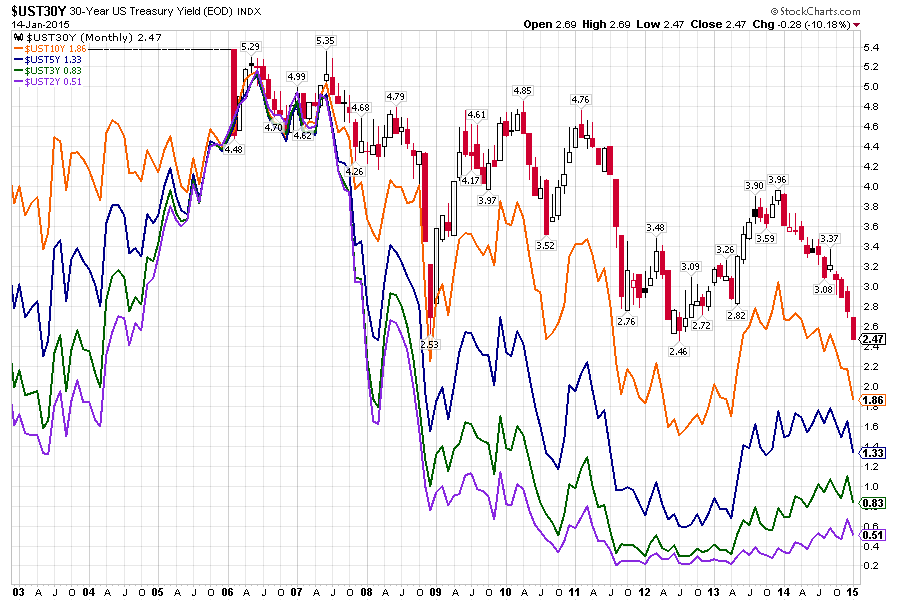
click on chart for sharper image
Huge Rally on Long End
| Duration | Color | 12/31/2013 | 2015-01-14 | PP Difference |
|---|---|---|---|---|
| 30-Year | Red | 3.96 | 2.47 | -1.49 |
| 10-Year | Orange | 3.04 | 1.86 | -1.18 |
| 5-Year | Blue | 1.75 | 1.33 | -0.42 |
| 3-Year | Green | 0.78 | 0.83 | 0.05 |
| 2-Year | Purple | 0.38 | 0.51 | 0.13 |
In contrast to economist predictions, the long end of the yield curve fell 1.49 percentage points (149 basis points). That the equivalent of 6 quarter point cuts, not hikes.
Meanwhile, yields rose slightly on 2-year and 3-year treasuries.
Buying the extreme long end of the curve while shorting 2- and 3-year treasuries would have gained both directions especially if one did the latter on the few small yield rallies that did take place.
Spreads
| Spread | 12/31/2013 | 2015-01-14 | Spread Shrinkage |
|---|---|---|---|
| 30Yr 10Yr | 0.92 | 0.61 | -0.31 |
| 30Yr 5Yr | 2.21 | 1.14 | -1.07 |
| 30Yr 3Yr | 3.18 | 1.64 | -1.54 |
| 30Yr 2Yr | 3.58 | 1.96 | -1.62 |
| 10Yr 5Yr | 1.29 | 0.53 | -0.76 |
| 10Yr 3Yr | 2.26 | 1.03 | -1.23 |
| 10Yr 2Yr | 2.66 | 1.35 | -1.31 |
| 5Yr 3Yr | 0.97 | 0.5 | -0.47 |
| 5Yr 2Yr | 1.37 | 0.82 | -0.55 |
| 3Yr 2Yr | 0.4 | 0.32 | -0.08 |
…