

Courtesy of Benzinga.

On April 1, Deutsche Bank released an extensive research note focused on the relative affordability of housing alternatives in major U.S. markets.
Looking back at the data from Q4 2014, and comparing it to historical data, DB concluded, "Home buying affordability likely to stay elevated through 2017."
However, as one would expect, there is considerable variation in individual markets when it comes to affordability.
DB – Big Picture Trends
- The West is the only region where renting is cheaper than buying.
- Renting compared to owning is the most expensive in the Northeast and Midwest.
- It was seasonally more expensive to rent in Texas, (but Y/Y trend improves).
- Midwest and Northeast are furthest from normalized, (based upon 1990's averages).
- Most metros were stable, (within +/- 2 percent Y/Y), with the exception of Texas (-5 percent) and the Midwest, (-4 percent).
How Can Investors Use This Information?
Where the "Rent-Buy Ratio" is less than 100, it is cheaper to rent; and where the ratio is higher, it is cheaper to buy, (for those who have the means and can qualify for a mortgage).
Clearly, this has implications for homebuilders moving forward, as well as REITs which own large multi-family communities and apartment buildings.
DB – Homebuilder Tailwinds/Headwinds
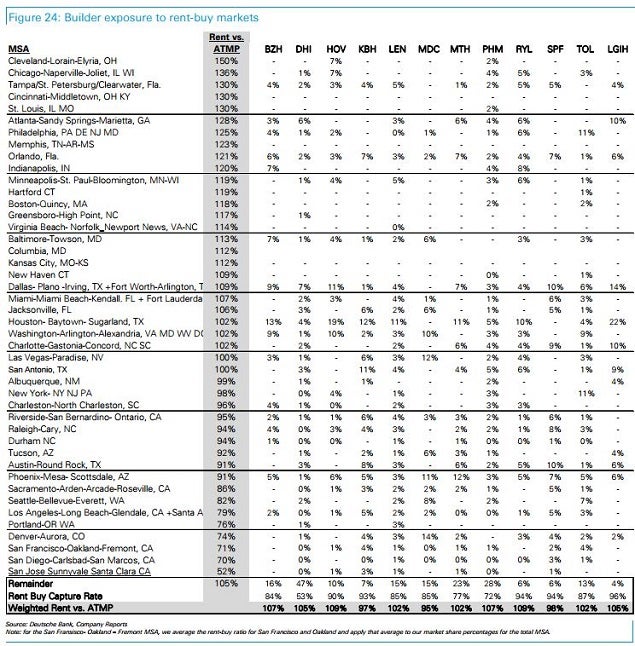
- Methodology: DB combined builder metro exposure data from [its] quarterly builder community count with [its] rent-buy data to create a rent-buy 'index' for each public home builder.
- Basically, DB "multiplied each builder's percentage market exposure by that markets rent as a % of ATMP," (after-tax mortgage payments), the calculation behind the "Rent-Buy Ratio."
- Hovnanian Enterprises (NYSE: HOV) – highest, with 109 percent ATMP.
- Ryland Group (NYSE: RYL) – highest, with 109 percent ATMP.
- MDC Holdings (NYSE: MDC) – lowest, with 95 percent ATMP, (where statistically it makes sense to rent).
Of course, on average, a person with one foot in ice and the other in hot coals is comfortable, and this data by itself certainly isn't going to predict homebuilder success or failure.
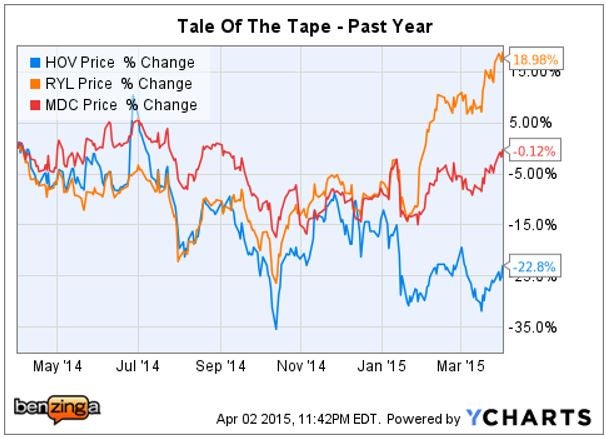
However, in the case of Ryland, they have clearly been on a tear the past few months, and this data confirms that communities they are building in are "target rich environments" when it comes to affordable homes for buyers.
Investors may want to use this information as a basis for further research.
Multifamily REIT – Headwinds/Tailwinds
DB looked at five multifamily REITs in its coverage universe, from the perspective of potential homebuyer, as well.
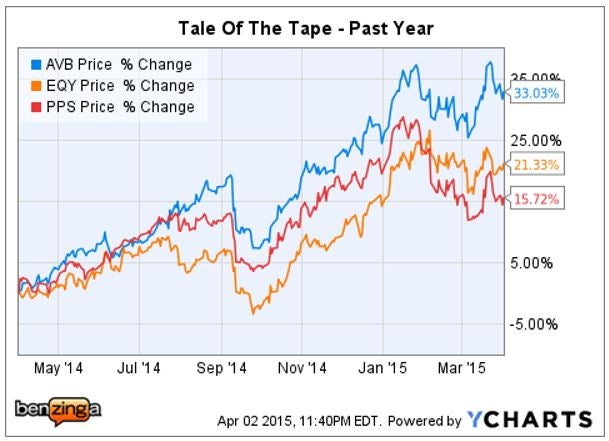
- Avalonbay Communities Inc. (NYSE: AVB) – most favorable for rental, with 90 rent-buy ratio.
- Equity Residential (NYSE: EQR) – also in great shape, with 91 rent-buy ratio.
- Post Properties Inc. (NYSE: PPS) – on the other hand, highest with ~114 rent-buy ratio.
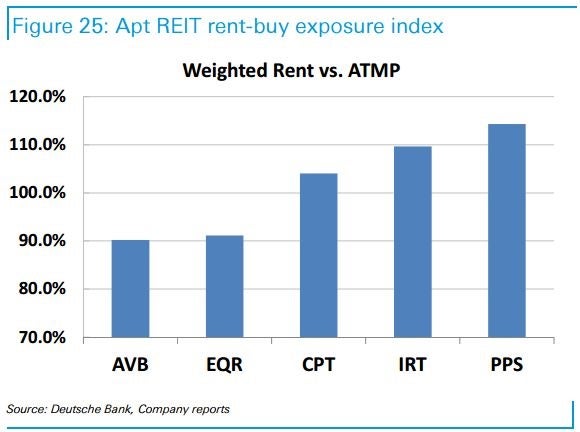
"The lower-than-average rent-to-ATMP ratios for both AVB and EQR are driven by above-average exposure to the rent-favorable West Coast markets," analysts explained.
"On the other end of the spectrum, PPS' markets have a roughly 114% rent-buy ratio, much higher than the national average, driven largely by its heavy exposure to Atlanta and Tampa."
DB – Markets Where Homebuilder Data Was Compiled
DB – Rent-Buy Ratio: 5 Year Comparison
The national rent-buy ratio is calculated as: "rent as percentage of after-tax mortgage payments (ATMP)," for the markets included in the survey.
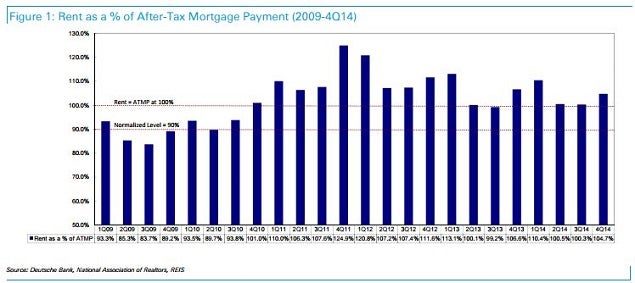
It has increased sequentially to 105 percent 4Q14 from 100 percent 3Q14, but is modestly down from the 107 percent reported in the same quarter last year.
Deutsche Bank extrapolated this data, along with other trends that they identified in the report, in order to conclude that overall, the environment for homebuilders is still looking net positive moving forward.
Latest Ratings for AVB
| Date | Firm | Action | From | To |
|---|---|---|---|---|
| Mar 2015 | RW Baird | Initiates Coverage on | Neutral | |
| Mar 2015 | Baird | Initiates Coverage on | Neutral | |
| Feb 2015 | Barclays | Maintains | Equal-weight |
View More Analyst Ratings for AVB
View the Latest Analyst Ratings
Posted-In: Deutsche Bank homebuildersAnalyst Color Education REIT Analyst Ratings General Real Estate Best of Benzinga


