

Courtesy of Mish.
Inquiring minds are investigating job creation. Here is the question at hand: What age group or age groups get the bulk of the jobs?
ZeroHedge claims No Country For Young Workers: Only Americans 55 And Older Found Jobs In March.
We first showed back in October 2012 that in America, courtesy of the Fed's micro-mismanagement of everything, the labor force has been turned upside down, and the only jobs being created are those for aged workers, Americans 55 and over. The reason is two-fold: with savings rates at zero, Americans who were on the verge of retiring found that the fruit of their labor was worth nothing under ZIRP (and may well be punished under the upcoming NIRP) as their savings (and fixed income investments) generate zero interest income, while young Americans would rather stay in college by the millions funded generously by trillions in Uncle Sam student loans.
All of this was on full display in today's jobs number, which while disappointing wildly based on Establishment survey data, was even worse based on the Household survey where only 34,000 people found jobs in March. But it was the age breakdown that was the stunner, and it can be seen best in the chart below.
In short: America continues to be a country where there are only jobs for old men, those 55 and older, who saw a 329,000 increase in jobs in the past month. Every other age group saw job losses!
March Job Losses by Age Group
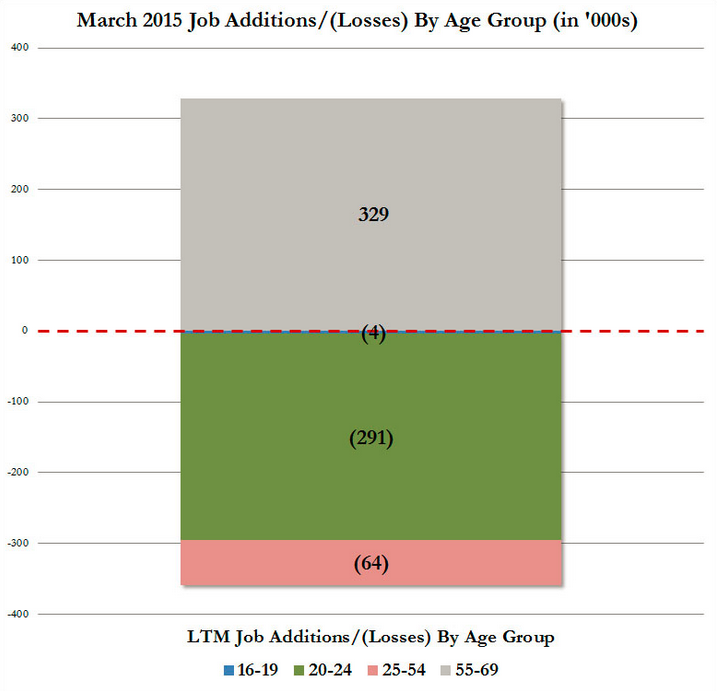
That was one of the charts ZeroHedge posted. Technically there is be nothing wrong with the chart, assuming the numbers are accurate.
However, the chart does not show where gains and losses are in a realistic manner.
A couple charts of my own will explain why.
55 and Over Employment
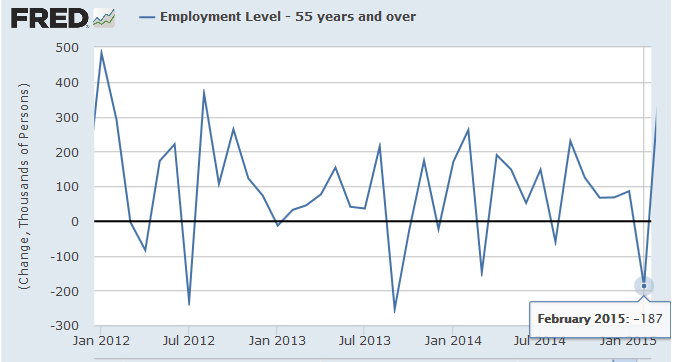
Note the volatility in this series. Last month employment in the 55 and over category declined by 187,000. This month it rose by 329,000. …