

Courtesy of Mish.
Economists got one right for a change. Retail sales bounced 1.2% led by autos vs. the Bloomberg Consensus Estimate of 1.3%.
Auto sales were known to be strong ahead of the report, likely steering economists in the right direction.
The consumer showed a lot of life in May, driving up retail sales 1.2 percent with gains sweeping nearly all components. A leading component in the month was motor vehicle sales which jumped 2.0 percent, excluding which retail sales still rose a very strong 1.0 percent. Another component showing special strength was gasoline sales which got a boost from higher prices. Still, excluding both of these components, retail sales ex-auto ex-gas gained a very solid 0.7 percent. These results offset weakness in April, when total sales rose only 0.2 percent (upward revised from no change).
In contrast to weakness through most of the April report, there’s only one component showing contraction in May and that’s the usually solid health & personal care stores at minus 0.3 percent. Standouts on the plus side, apart from vehicles and gasoline, are building materials & garden equipment stores, up 2.1 percent, clothing & accessories stores, up 1.5 percent, and nonstore retailers, up 1.4 percent. Department stores, which sank a steep 2.9 percent in April, rebounded with a 0.8 percent gain.
The long awaited rebound from the soft first quarter is finally here. Today’s results will have forecasters upping their estimates for second-quarter GDP. These results will also be a key point of discussion, especially in arguments by the hawks, at next week’s FOMC meeting.
Snapback
A sales snapback was coming at some point. May was the month following months of disappoints.
This will add to GDP. We will see how much in the Atlanta Fed GDPNow forecsast later today.
Year-Over-Year Picture Not Strong
In spite of the snapback, year-over-year sales except for autos are hardly robust. A picture from the Commerce Department Advance Retail Sales Report for May 2015 tells the story.
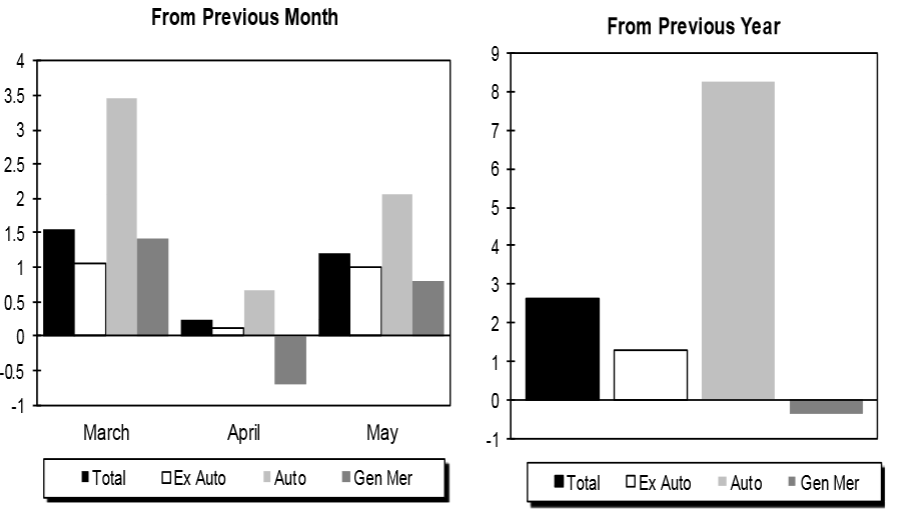
click on chart for sharper image
Year-Over-Year Numbers …