

 $16,100,000,000,000.00.
That's how in-debt Chinese companies are. China's GDP is officially $9Tn – if you believe the current numbers they are reporting, which many people do not. Even so, that makes Corporate Debt alone 177% of GDP but, much, MUCH more importantly than that, it's 23 TIMES more than the $676Bn in Corporate Profits earned last year, which means a rise in interest rates to 5% would wipe out ALL of the profits of Chinese companies.
Rather than addressing the situation, China's banks made $206Bn in new loans in June, on pace to add more than 10% to Corporate Debt in 2015 but, more importantly, $2.4Tn in new debt in 2015 would be 26% of China's entire (reported) GDP in Corporate borrowings. Would you be concerned if US Corporations were reporting $4.7Tn in new debt this year? How concerned would you be when you realized that a full 1.5% of that GDP was made up of interest and fees the banks were charging for making these loans?
 Chinese manufacturers' debts are increasingly dwarfing their profits. A Thomson Reuters study found that in 2010, materials companies' debts were 2.8 times their core profit and, at the end of 2014, they had ballooned to 5.3 times CORE (gross) profits. For energy companies, indebtedness has risen from 1.1x to 4.4x core profits. For industrials, from 2.5x to 4.2x.
Even worse (yes, it can be worse) for many companies in China, they are making profits NOT on their business but in the markets! Jinxi Axel Co, for example, has 10.5x their profits in debt and has their money in bank instruments that pay them enough interest to service their debt – they are not using it to invest in their business at all! "The risk for these (capital) programmes is so high and the rate of return so low that we have to make the best decision for our investors (by) purchasing bank products." said Gao Hong of the company's Investor Relations department.
 S&P expects China's companies to account for 40 percent of the world's new corporate lending in the period through 2019. Rapid debt growth, opacity of risk and pricing and very high debt to GDP are a hazardous combination, Standard & Poor's says. "Managing the debt market is probably more dangerous than the stock market because the scale of the debt market is bigger, and without any high-profile default, the moral hazard is a significant issue," said David Cui, BofA Merrill Lynch analyst.
CASH!!! People! Cash, cash, Cash and more CASH!!! I can only tell you and show you that the conditions we are seeing now – INCLUDING the market-boosting Government bailouts – are VERY similar to what happened in 2007/8 leading up to the collapse. That is the limit of my ability. In 2007 and early 2008 I was also "wrong" and the markets went up and I said it was ridiculous and the markets went up and I warned people to go to cash and the markets went up and my only regret was that I didn't do MORE to warn people how dangerous the markets were at the time.
- 5/20/2007 – Record Weekly Wrap-Up – "We are however far more hedged than we were entering the week and I will feel downright silly if we don’t get some kind of pullback ahead of the holiday weekend… We have pulled most of the winners off the table but still have our large protective puts (obviously not winners!) in place.
- 8/24/2007 – I Will Gladly Pay You Tuesday – "The problem is (aside from the fact that these funds’ performance have pretty much gone down the tubes) that there is not enough ACUTAL money in the world to pay these rich people what they thing they’re worth. That’s what a liquidity crisis is, not enough actual cash to back up our phony-baloney asset prices."
- 9/7/2007 – Stop the Markets – We Want to Get Off! – Earlier Wednesday, I explained my rationale for being trigger happy on poorly performing positions in this market, saying: "I can always buy it back or roll down or do 100 other things with cash but the only thing I can do with a poor position if it bounces back is wait and pray – not my favorite strategy!"
- 1/15/2008 – Troubling Tuesday Morning – This is the basis of the mighty US financial system, which sucks up over 20% of the nation’s wealth each year in the form of fees and interest rates and has built an economic house of cards on the myth that infinitely rising commodity prices would be paid by leveraging every last asset the US consumer has in order to pay for them and pumping up those asset prices (homes, stocks) by flooding the markets with easy money, all the while pushing to enact Draconian bankruptcy laws to make sure they get their pound of flesh when it all hits the fan.
- 3/14/2008 – Follow-Through Friday??? – Asia sold off last night despite our very decent day with the Nikkei falling 191 points in a poor afternoon session while the Hang Seng fell 64 points, flat-lining at the 22,200 mark, almost exactly 30% off the November highs of 31,800 and back to the level they broke out from last year. Are we seeing signs of global rotation out of Asia (still out gaining the Dow by over 2:1 over the past year) that is following the cheap dollar into US equities or is the entire global market party coming to an end?
- 5/8/2008 – Thursday Wrap-Up – I see no justification for this rally and I said to members yesterday as CNBC had a discussion that $120 oil was a good thing for the economy: "Yet another BS justification. Come on guys – the last time we got this much "good news" about an investment from the media was housing… Oil $124.33 and a Rebel Attack in the morning should punch us through $125."
- 7/5/2008 – 50% (of the Dow, of the Year) Report – It doesn’t sound at all good does it and, if I were a foreign investor, I wouldn’t touch this banana republic with a 10-foot pole – and they didn’t! Foreigners have been panicking out of US equities since last fall and have driven the Dow back to it’s post 9/11 lows at 7,200. No, I’m not on another investing planet, on the left is a chart from Seeking Alpha of the Dow adjusted for Euros since 2001 – not a pretty picture is it?
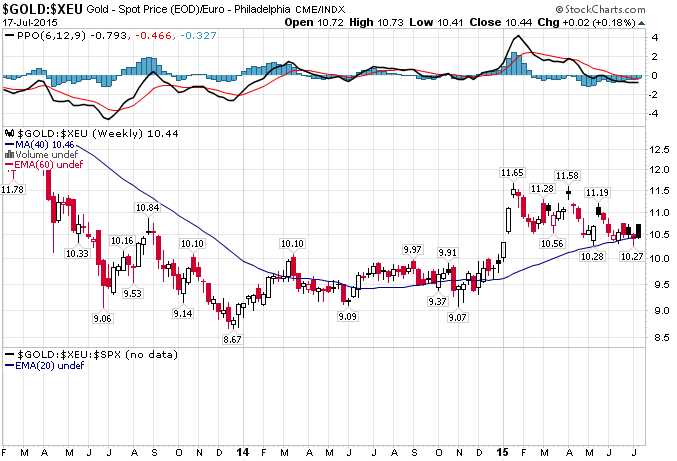 At the time, I was making the point that, in steady Dollar terms, the Dow had already made the same low it had made back in 2001. Oddly enough, I have been trying to make that point re. gold to our Members, most of whom track the performance in Dollars, not Euros or Yen, where gold is still up 15% over last year's average which, in the US, was about $1,250.
Rather than showing $1,400(ish) though, gold is at $1,109 strong Dollars or 140,000 weak Yen. That's up from 30,000 strong Yen in 2004 so, if you were a Japanese buyer of gold, you would be up 366% at the same time US buyers are up only 146%. For Europeans, gold was 334 Euros/oz in Jan, 2004 and now it's 1,023 – up 206%, still better than the US but far short of Japanese investors. This is what diversification is all about – gold is a hedge on your currency devaluing. If you are losing money in gold, you can take solace in the fact that your money is worth more.
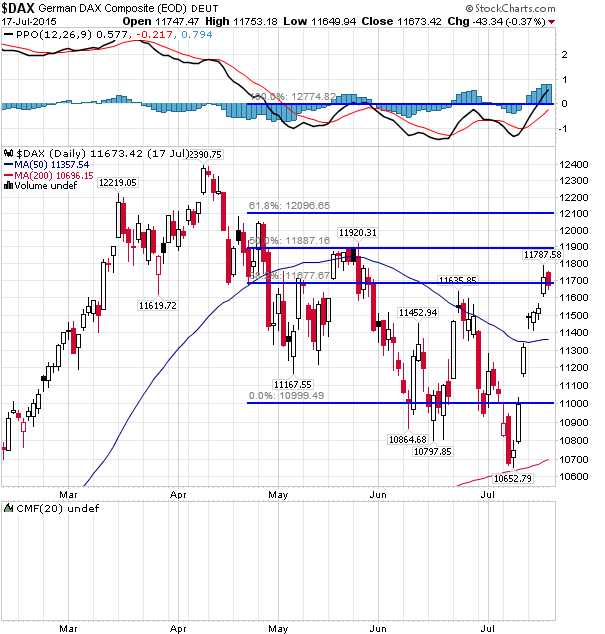 Priced in Euros, in fact, the S&P is back to just under the all-time high it hit in April – another 1% will do it (2,130). It's about the same in Yen so the question is, will Japanese and European computers begin selling again once we're back at those trigger points? When we look at a foreign index level, like DAX 11,500 (our weak bounce line) that's 11,500 priced in Euros so the line that we were using in May and June when the Euro was at $1.12 should also be adjusted up 3% with the Euro at $1.085.
That means we should adjust the 12,400 high of the DAX up to 12,772 and it means the DAX doesn't get a strong bounce until 11,845. We don't usually worry about currency fluctuations when we're doing our charts as they don't usually move this violently but here we get a much clearer picture by taking them into account.
I've adjusted the Fibonacci lines on the Dax chart to reflect the 3% drop in the Euro and now we see that we're only just testing the Strong Bounce line today – so don't be fooled by foolish TA analysts (pretty much all of them) who fail to take currency fluctuations into account when drawing their charts. Do you know why they don't? That would require actual work and thinking about more than where to draw the next squiggly line and, as Barbie says "math is hard!"
Be careful out there…